Personal License
Non-commercial use
Free for personal use
- Perpetual license
- Non-commercial use only
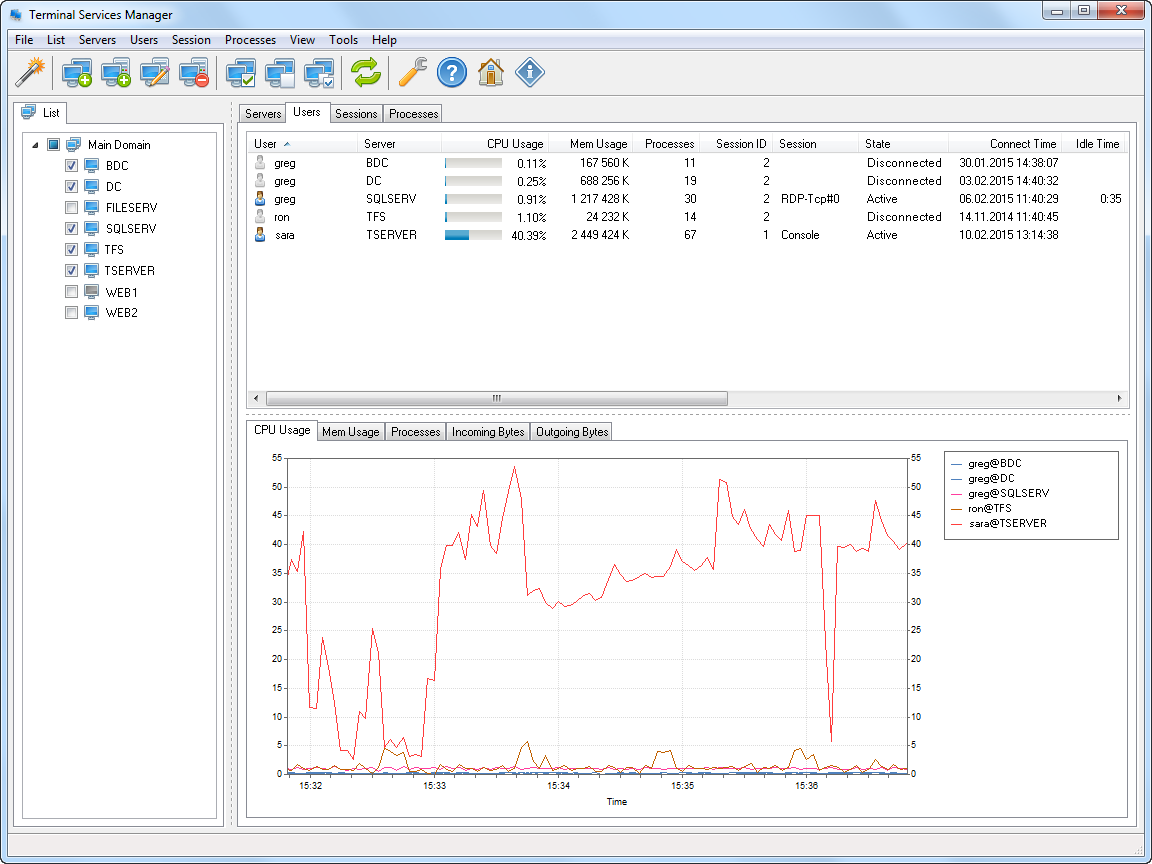
Terminal Services Manager connects to all your Remote Desktop hosts at once and shows every session, user, and process on one screen. You see what is happening and act on it without opening a console on each server.

Terminal Services Manager connects to one or more RDS servers and shows every session, user, and process in one place. CPU, memory, and 11 more server metrics render on interactive charts with zoom, pan, and measurement, and the legend shows min, max, average, and current values in real time.
Per-user columns show frame rate and frame quality, with a signal-strength icon that rates each session's connection health. Diagnostic counters (packet loss, retransmission, frames skipped, encoding time) help you spot troubled sessions fast.
You can audit user activity, monitor failed logon attempts, manage user profiles remotely, and enable or disable Remote Desktop on remote computers. Log off or disconnect idle users in bulk, send messages, and shadow user sessions.
The interface has Dark Mode with automatic switching based on your Windows theme, high-DPI support, and works on Windows 11.
Watch sessions, act on them, and keep an eye on every server from one place.
Per-process CPU, memory, handles, and threads on remote servers. End runaway tasks remotely.
Zoom, measure, and export CPU and memory charts, with min, max, and average in the legend.
Filter sessions and processes with AND/OR rules, numeric ranges, and quick search.
133 built-in commands across 12 categories, plus your own custom tools.
Log off, disconnect, shadow, and message users across all your servers.
+7 more See all featuresThe views and actions you reach for most when you run Remote Desktop hosts.
CPU, memory, and 11 additional server metrics: available memory, pagefile usage, disk free space, disk read/write speed, disk busy percentage, disk queue length, network bytes received and sent, and system uptime. All with real-time interactive charts.

Log off or disconnect idle users across servers by time threshold. Log off disconnected users to clean up stale sessions. Shadow (remote control) user sessions. Manage user profiles on remote computers.
Track user activity: logon, logoff, disconnect, and reconnect events. Monitor failed logon attempts. View RDS licensing info. Send messages to users with presets and variables. Restart or shut down servers remotely. Export lists to CSV.

Released Apr 7, 2026. A focused update on monitoring and connection quality.
Full release notesInstall it on one workstation. It talks to your servers over the protocols they already use.
Start free for personal use, then buy a commercial license when you roll it out at work.
Non-commercial use
Commercial, per machine
Whole organization
Short answers on licensing and setup.
The Microsoft Remote Desktop Services Manager (the old tsadmin.msc) manages one server at a time, and Microsoft removed it from Windows Server after 2008 R2. Terminal Services Manager is an alternative that works on all current versions of Windows and manages many hosts together.
From a single window it shows the sessions, users, and processes of every server in your list at once, with live CPU, memory, disk, and network metrics. It keeps the familiar actions - disconnect, log off, shadow, send message, reset - and adds session history, failed logon auditing, filtering, and graphs. For the full story on where the old snap-in went, see where is Terminal Services Manager in Windows Server 2012 and later.
No. Terminal Services Manager is agentless. It connects to each Remote Desktop Services host using the Windows interfaces already built into the operating system: the WTS (Terminal Services) API for sessions, users, and processes; performance counters for CPU and memory; and the event log for session history. Nothing is installed or left running on the machines you manage.
You install the program only on your own workstation or a management server. The hosts you manage need to be reachable over the network, and you need administrator rights on them. To get started, see How to add your RDS servers and connect with the right account and System requirements.
The latest version of Terminal Services Manager supports the following Windows platforms: Windows 10, Windows Server 2016, Windows Server 2019, Windows Server 2022, Windows 11, Windows Server 2025.
It runs on any Windows version that ships Remote Desktop Services and the supporting WMI and RPC interfaces, on both workstations and servers. For the full list and the rights you need, see System requirements.
Yes, for personal use. The Personal License is free and perpetual, for non-commercial use only.
Using it at work needs a paid license. A Business License covers one machine and includes a year of updates. A Corporate License covers a whole organization, with unlimited installations and technicians. Prices are on the purchase page.
If you want to try it first, the evaluation copy has no feature limits: every feature, on one computer, with a reminder at startup.
There are no feature limitations in an unregistered copy. During the evaluation period you can use every feature of Terminal Services Manager on a single computer, exactly as in a registered copy. Unregistered copies show a reminder screen at startup, and use is limited to one machine on the network.
To remove the reminder and run the program on more machines, register your license. See also how to order and using it on more than one computer.
Terminal Services Manager uses standard Windows management protocols, so the same ports you would open for any remote administration are enough. On each managed host, allow access from your workstation to:
On a domain network the built-in Remote Administration and Windows Management Instrumentation (WMI) firewall rule groups already open these. To get hosts into the program in the first place, see How to add your RDS servers and connect with the right account.
Other tools that pair well with Terminal Services Manager.
Powerful tool for managing, monitoring and analyzing processes on a local or remote computer.
Monitoring and analyzing Remote Desktop Services logs.
IP scanner for network analysis that will allow you to see all network computers in several seconds.