Terminal Services Manager 26.04 - What's New
Native 64-bit, session history, connection quality score, and HTML reports.
Terminal Services Manager 26.04 is the first native 64-bit release. Previous versions were 32-bit only. This version also adds session history tracking with reports, a numeric connection quality score, and HTML export for four dialogs.
Native 64-bit
All previous versions of Terminal Services Manager were 32-bit. Version 26.04 is the first native 64-bit build. Many of you asked for this, and here it is.
The switch to x64 removes the 4 GB memory limit. All future versions will be 64-bit only.
Session history
View user session activity over any time period. The dialog reads logon, logoff, disconnect, and reconnect events from the Windows Event Log and reconstructs individual sessions.
Filtering and display. Choose a predefined period (last hour, today, last 7/30/90 days, this week, this month, etc.) or set a custom date range. Filter by user name with wildcard support (*). Sessions are shown in a list with columns: User, State, Session ID, Logon time, Logoff time, Duration, Active time, Disconnects, and Client address. Each session has a state: Active, Disconnected, Completed, or Partial (started before the selected period).
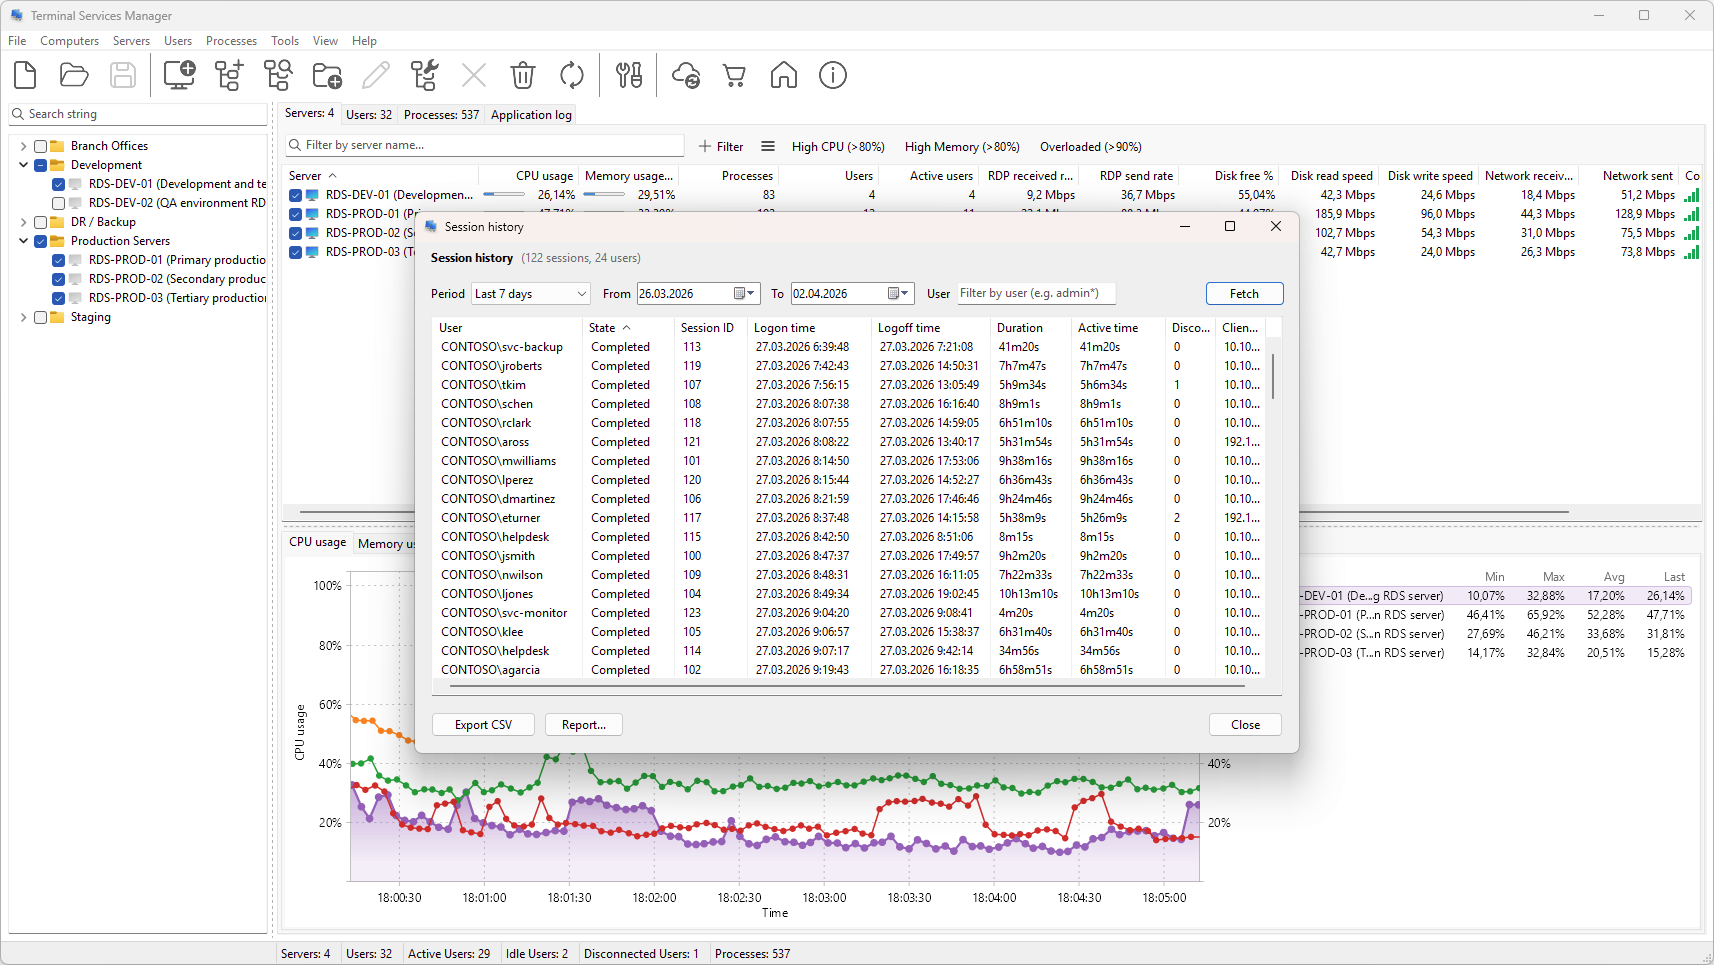
CSV export. Export the visible session list to a CSV file.
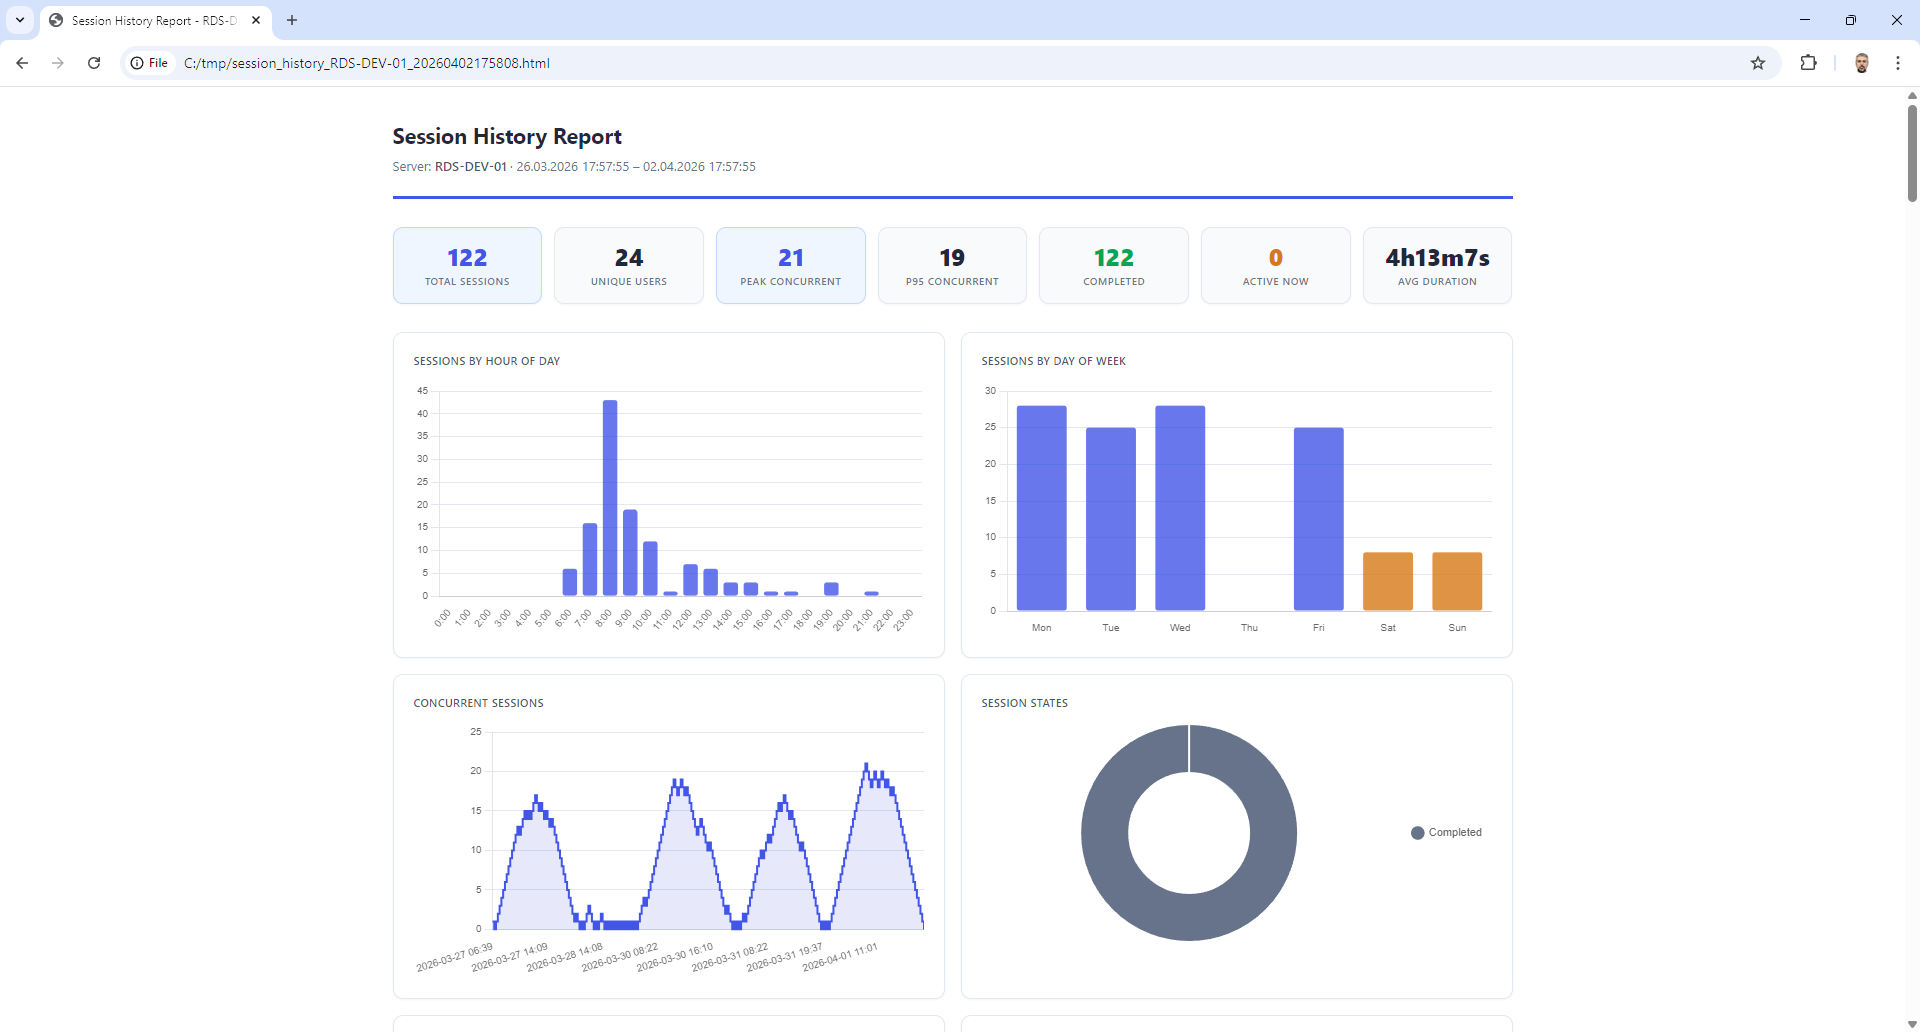
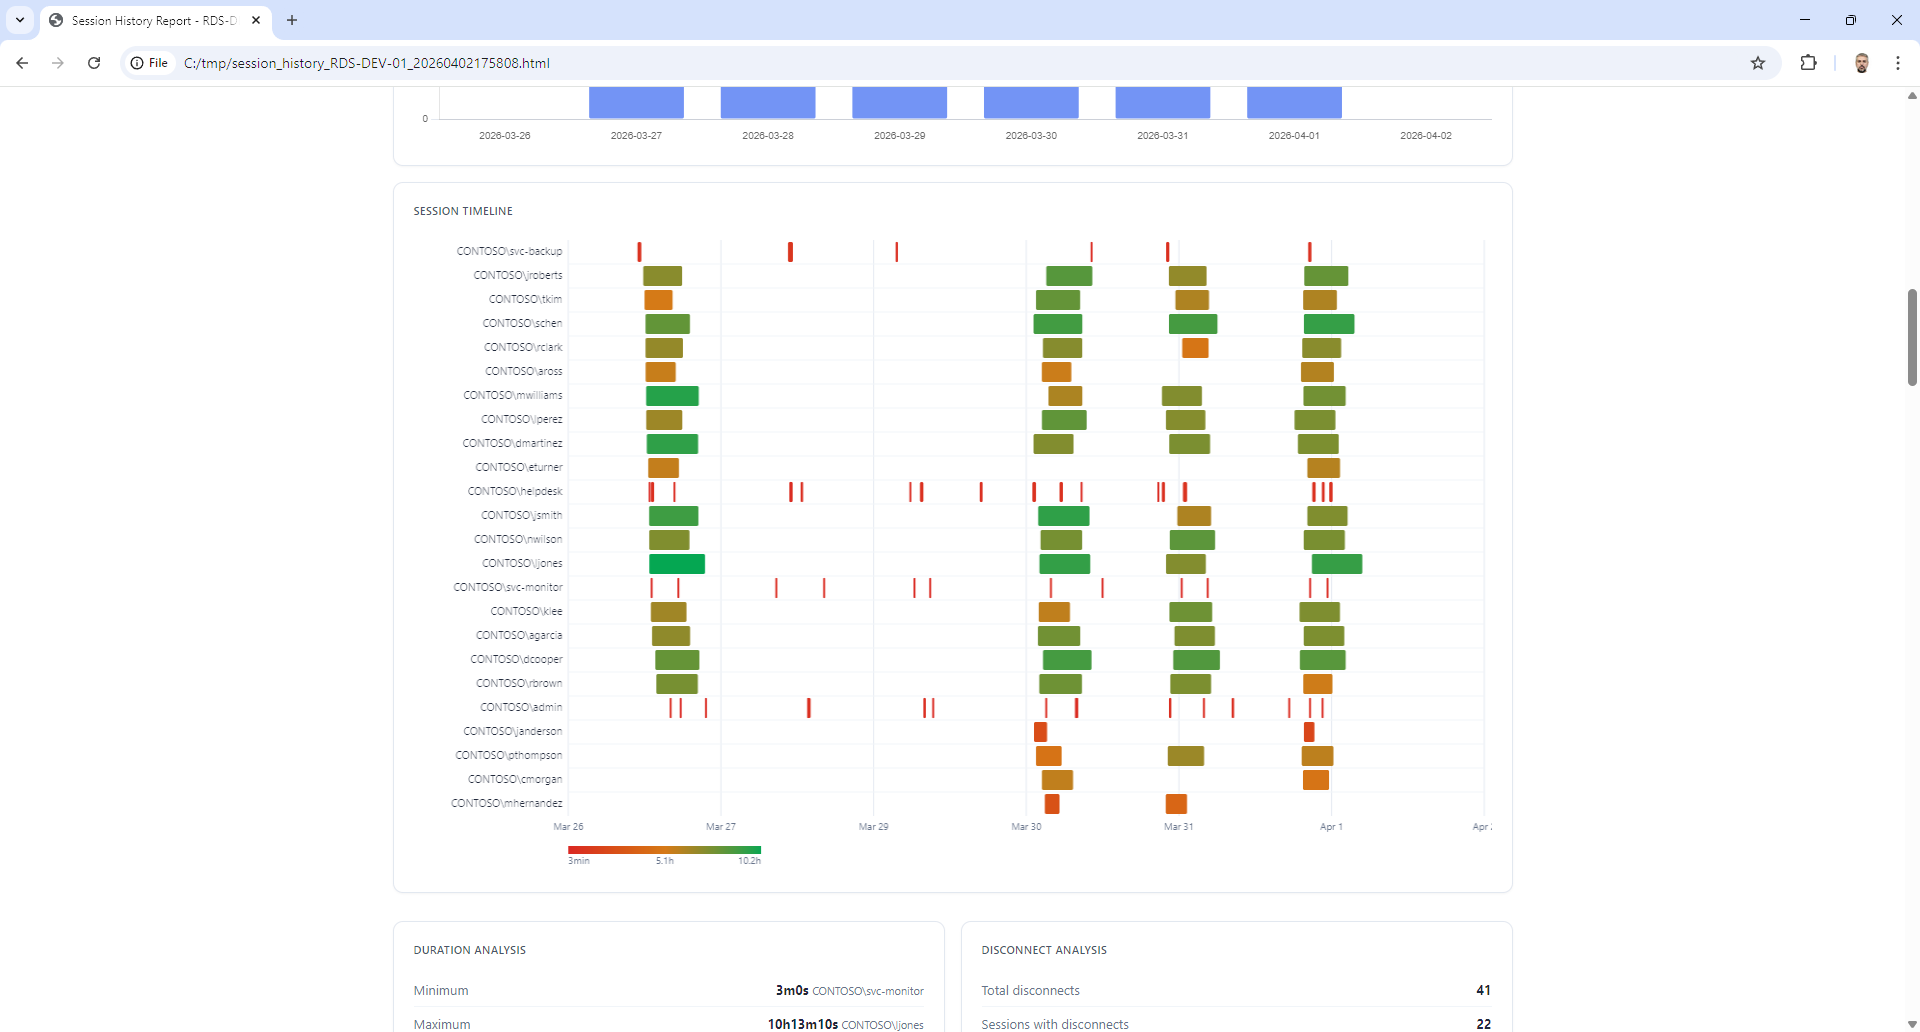
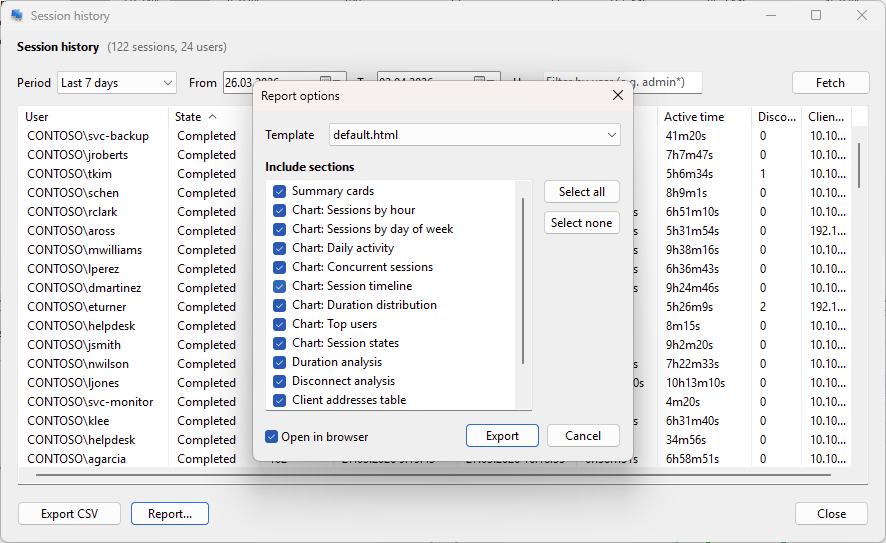
HTML report. Generate a self-contained HTML report with up to 14 selectable sections:
Summary cards: total sessions, unique users, peak concurrent sessions, average duration
Charts: sessions by hour of day, by day of week, daily activity, concurrent sessions over time (line chart), session timeline (Gantt-style, top 20 users), duration distribution histogram, top users by session count, session state distribution (donut chart)
Duration analysis: minimum, maximum, median, average, and 95th percentile
Disconnect analysis: total disconnects, sessions affected, clean sessions, average disconnect duration
Tables: client IP addresses with user lists, per-user statistics (session count, total and average duration, active time, efficiency ratio, disconnects), and full session details
Charts are interactive (Chart.js) with hover tooltips and responsive layout.
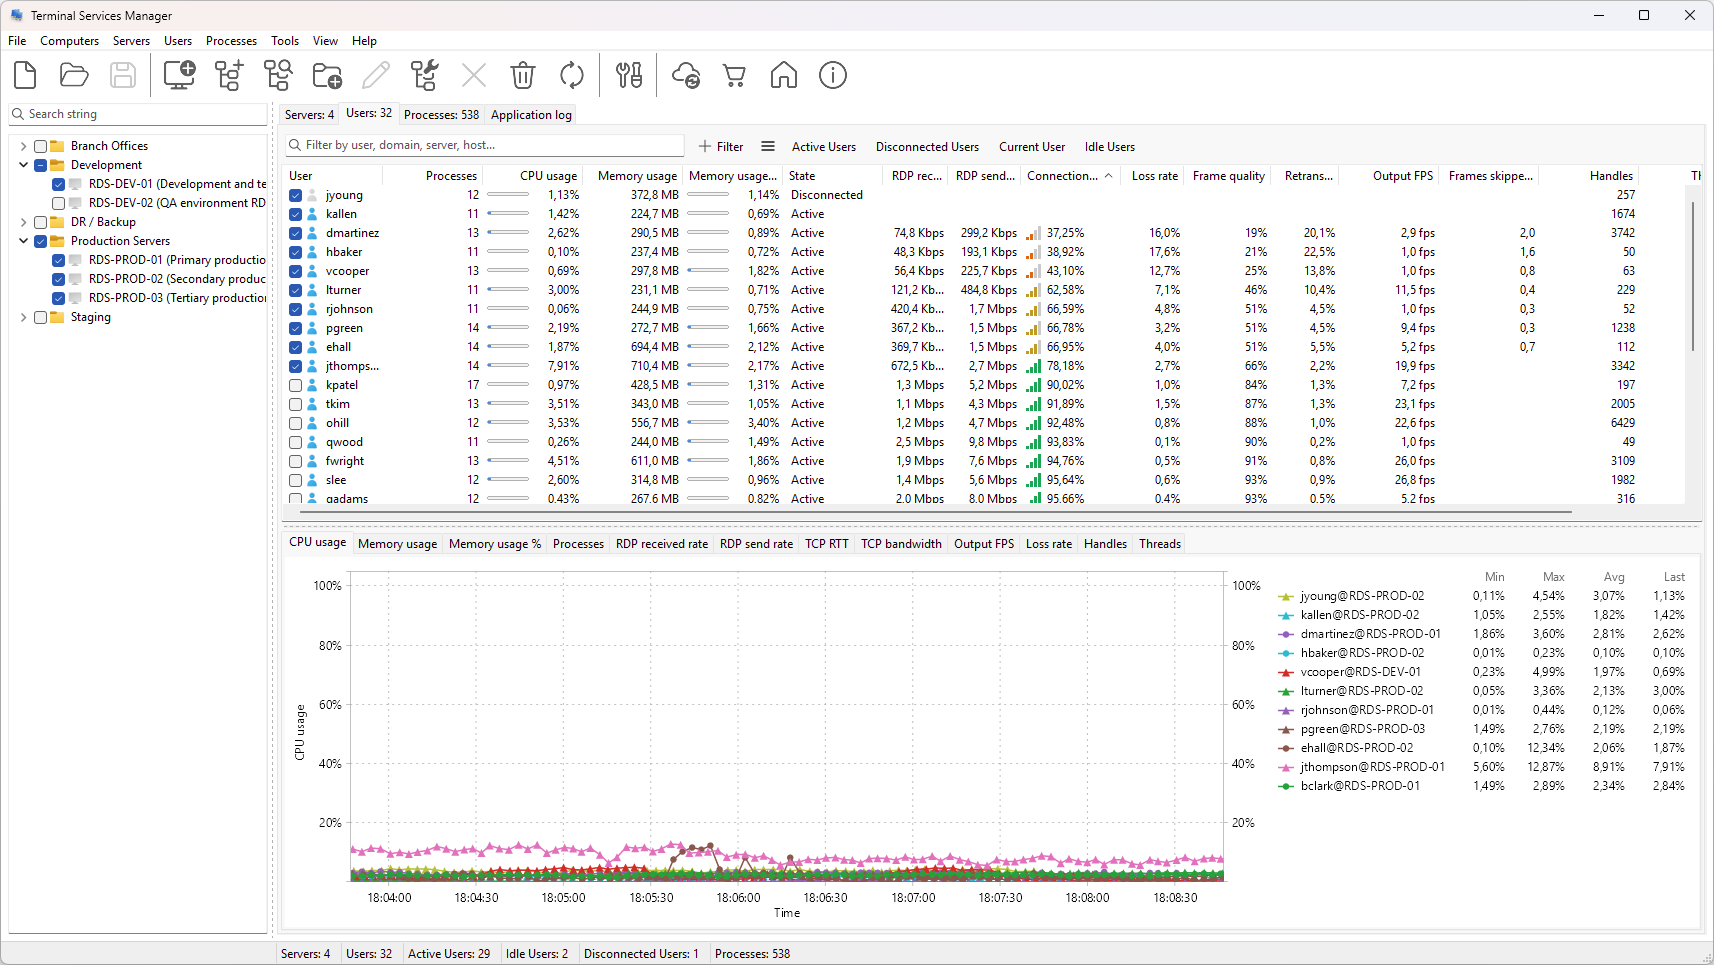
Connection quality score
Each user session gets a numeric quality score from 0 to 100%, calculated as a weighted geometric mean of four RemoteFX metrics:
Packet loss rate (weight 0.30)
Frame quality (weight 0.30)
Retransmission rate (weight 0.20)
Frames skipped per second (weight 0.20)
The geometric mean ensures that a single severely degraded metric drags the overall score down, which matches how users perceive quality. TCP RTT is not included because RDP 8.0+ uses UDP as the primary transport and TCP RTT values can be stale.
The column shows the percentage alongside a signal-strength icon colored by quality level: Excellent (75%+, green), Good (50-74%, yellow), Fair (25-49%, orange), or Poor (below 25%, red). Available for both users and servers. The server-level score is the median across all active sessions.
Two filter presets help you find problem sessions: "Poor Connection" (below 25%) and "Degraded Connection" (below 50%).
HTML reports
Session History, User Activities, Failed Logons, and User Profiles dialogs can export data to a self-contained HTML file. You pick which sections to include before export. Reports have their own charts (Chart.js, interactive) and tables with computed analytics.
Session History (14 sections): summary cards, 8 chart types (hourly and daily distributions, concurrent sessions, Gantt timeline, duration histogram, top users, state breakdown), duration and disconnect statistics, tables for client IPs, per-user statistics, and individual sessions.
Failed Logons (8 sections): summary cards (total attempts, unique users, unique source IPs, failure reasons), charts (hourly and daily distribution, failure reasons breakdown, top targeted users, top source addresses), tables with targeted users, source addresses, and event details.
User Activities (8 sections): summary cards (total events, logon/logoff/disconnect/reconnect counts), charts (hourly and daily distribution, event type breakdown, top users), tables with client IPs, user statistics, and event details.
User Profiles (5 sections): summary cards (total profiles, loaded/local/roaming/temporary counts, average size), charts (profile type distribution, size distribution, inactivity analysis), and a profile details table.
Configurable server response timeout
Set how long the program waits for a server to respond before canceling the request. Go to File > Preferences > Terminal Services and adjust "Server response timeout" in the Server refresh group. Range: 10 to 300 seconds (default: 30). Useful for servers on slow WAN links that previously timed out.
Background update stability
Background server data retrieval is more reliable. Fewer interruptions when polling multiple servers at once, especially on networks with mixed response times.
License key format change
Version 26.04 uses a new license key format. Previous keys will not work. After updating, the program will run in trial mode until you enter a new key (Help > Enter registration code).
Commercial customers with active support: reissue your key through the Customer Portal or write to support@lizardsystems.com.
Commercial customers with expired support: your current version continues to work. If you want to update, renew your support first. There is no penalty for the gap in coverage.
Personal use: register on our website for a free Personal license (non-commercial, doesn't expire).
System requirements: Windows 10 x64 or later. 32-bit (x86) systems are no longer supported.
Download: https://lizardsystems.com/terminal-services-manager/