Network Command-line Utilities
These utilities must be run at the prompt of the Cmd.exe command interpreter. To open Command Prompt, click Start, click Run, type cmd, and then click OK.
TCP/IP utilities offer network connections to other computers, such as UNIX workstations. You must have the TCP/IP network protocol installed to use the TCP/IP utilities.
Some command-line tools require the user to have administrator-level privileges on source and/or target computers.
-
arp
-
ipconfig
-
ping
-
tracert
-
pathping
-
netstat
-
nbtstat
Arp
Displays and modifies entries in the Address Resolution Protocol (ARP) cache, which contains one or more tables that are used to store IP addresses and their resolved Ethernet or Token Ring physical addresses. There is a separate table for each Ethernet or Token Ring network adapter installed on your computer. Used without parameters, arp displays help.
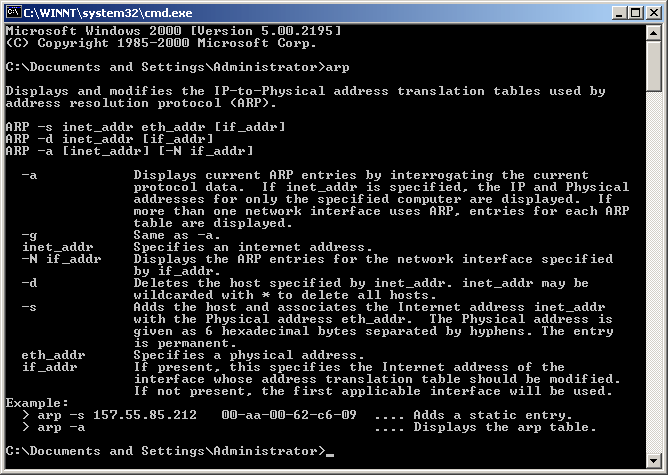
This command is available only if the Internet Protocol (TCP/IP) protocol is installed as a component in the properties of a network adapter in Network Connections Syntax
arp [-a [InetAddr] [-N IfaceAddr]]
  [-g [InetAddr] [-N IfaceAddr]]
  [-d InetAddr [IfaceAddr]]
  [-s InetAddr EtherAddr [IfaceAddr]]
Examples
To display the ARP cache tables for all interfaces, type:
arp -a
To display the ARP cache table for the interface that is assigned the IP address 10.0.0.99, type:
arp -a -N 10.0.0.99
To add a static ARP cache entry that resolves the IP address 10.0.0.80 to the physical address 00-AA-00-4F-2A-9C, type:
arp -s 10.0.0.80 00-AA-00-4F-2A-9C
Ipconfig
Displays all current TCP/IP network configuration values and refreshes Dynamic Host Configuration Protocol (DHCP) and Domain Name System (DNS) settings. Used without parameters, ipconfig displays the IP address, subnet mask, and default gateway for all adapters.
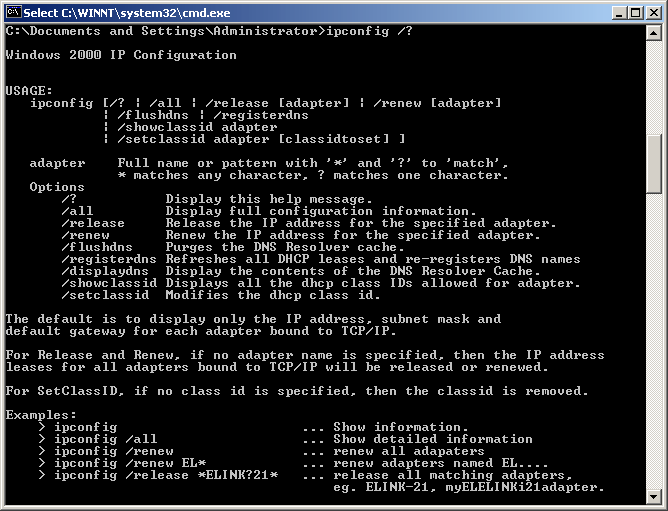
This command is most useful on computers that are configured to obtain an IP address automatically. This enables users to determine which TCP/IP configuration values have been configured by DHCP, Automatic Private IP Addressing (APIPA), or an alternate configuration. Syntax
ipconfig [/all]
       [/renew [Adapter]]
       [/release [Adapter]]
       [/flushdns]
       [/displaydns]
       [/registerdns]
       [/showclassid Adapter]
       [/setclassid Adapter [ClassID]]
Examples
To display the basic TCP/IP configuration for all adapters, type:
ipconfig
To display the full TCP/IP configuration for all adapters, type:
ipconfig /all
To renew a DHCP-assigned IP address configuration for only the Local Area Connection adapter, type:
ipconfig /renew "Local Area Connection"
To flush the DNS resolver cache when troubleshooting DNS name resolution problems, type:
ipconfig /flushdns
To display the DHCP class ID for all adapters with names that start with Local, type:
ipconfig /showclassid Local*
To set the DHCP class ID for the Local Area Connection adapter to TEST, type:
ipconfig /setclassid "Local Area Connection" TEST
Ping
Verifies IP-level connectivity to another TCP/IP computer by sending Internet Control Message Protocol (ICMP) Echo Request messages. The receipt of corresponding Echo Reply messages are displayed, along with round-trip times. Ping is the primary TCP/IP command used to troubleshoot connectivity, reachability, and name resolution. Used without parameters, ping displays help.
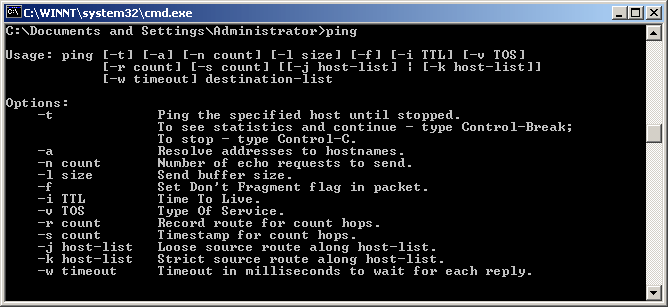
You can use ping to test both the computer name and the IP address of the computer. If pinging the IP address is successful, but pinging the computer name is not, you might have a name resolution problem. In this case, ensure that the computer name you are specifying can be resolved through the local Hosts file, by using Domain Name System (DNS) queries, or through NetBIOS name resolution techniques. Syntax
ping [-t]
   [-a]
   [-n Count]
   [-l Size]
   [-f]
   [-i TTL]
   [-v TOS]
   [-r Count]
   [-s Count]
   [{-j HostList | -k HostList}]
   [-w Timeout]
   [TargetName]
Examples
The following example shows ping command output:
C:\>ping example.microsoft.com
Pinging example.microsoft.com [192.168.239.132] with 32 bytes of data:
Reply from 192.168.239.132: bytes=32 time=101ms TTL=124
Reply from 192.168.239.132: bytes=32 time=100ms TTL=124
Reply from 192.168.239.132: bytes=32 time=120ms TTL=124
Reply from 192.168.239.132: bytes=32 time=120ms TTL=124
To ping the destination 10.0.99.221 and resolve 10.0.99.221 to its host name, type:
ping -a 10.0.99.221
To ping the destination 10.0.99.221 with 10 Echo Request messages, each of which has a Data field of 1000 bytes, type:
ping -n 10 -l 1000 10.0.99.221
To ping the destination 10.0.99.221 and record the route for 4 hops, type:
ping -r 4 10.0.99.221
To ping the destination 10.0.99.221 and specify the loose source route of 10.12.0.1-10.29.3.1-10.1.44.1, type:
ping -j 10.12.0.1 10.29.3.1 10.1.44.1 10.0.99.221
Tracert
Determines the path taken to a destination by sending Internet Control Message Protocol (ICMP) Echo Request messages to the destination with incrementally increasing Time to Live (TTL) field values. The path displayed is the list of near-side router interfaces of the routers in the path between a source host and a destination. The near-side interface is the interface of the router that is closest to the sending host in the path. Used without parameters, tracert displays help.
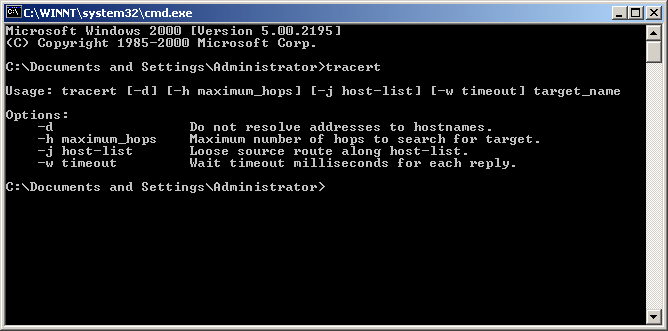
This diagnostic tool determines the path taken to a destination by sending ICMP Echo Request messages with varying Time to Live (TTL) values to the destination. Each router along the path is required to decrement the TTL in an IP packet by at least 1 before forwarding it. Effectively, the TTL is a maximum link counter. When the TTL on a packet reaches 0, the router is expected to return an ICMP Time Exceeded message to the source computer. Tracert determines the path by sending the first Echo Request message with a TTL of 1 and incrementing the TTL by 1 on each subsequent transmission until the target responds or the maximum number of hops is reached. The maximum number of hops is 30 by default and can be specified using the -h parameter. The path is determined by examining the ICMP Time Exceeded messages returned by intermediate routers and the Echo Reply message returned by the destination. However, some routers do not return Time Exceeded messages for packets with expired TTL values and are invisible to the tracert command. In this case, a row of asterisks (*) is displayed for that hop.
Syntax
tracert [-d]
      [-h MaximumHops]
      [-j HostList]
      [-w Timeout]
      [TargetName]
Examples
To trace the path to the host named corp7.microsoft.com, type:
tracert corp7.microsoft.com
To trace the path to the host named corp7.microsoft.com and prevent the resolution of each IP address to its name, type:
tracert -d corp7.microsoft.com
To trace the path to the host named corp7.microsoft.com and use the loose source route 10.12.0.1-10.29.3.1-10.1.44.1, type:
tracert -j 10.12.0.1 10.29.3.1 10.1.44.1 corp7.microsoft.com
Pathping
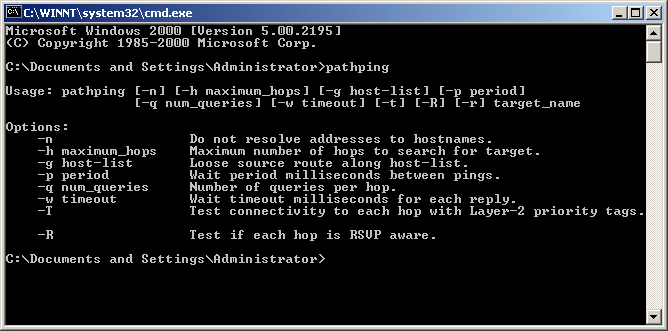
Provides information about network latency and network loss at intermediate hops between a source and destination. Pathping sends multiple Echo Request messages to each router between a source and destination over a period of time and then computes results based on the packets returned from each router. Because pathping displays the degree of packet loss at any given router or link, you can determine which routers or subnets might be having network problems. Pathping performs the equivalent of the tracert command by identifying which routers are on the path. It then sends pings periodically to all of the routers over a specified time period and computes statistics based on the number returned from each. Used without parameters, pathping displays help.
Syntax
pathping [-n]
       [-h MaximumHops]
       [-g HostList]
       [-p Period]
       [-q NumQueries]
       [-w Timeout]
       [-T]
       [-R]
       [TargetName]
Examples
The following example shows pathping command output:
D:\>pathping -n corp1
Tracing route to corp1 [10.54.1.196]
over a maximum of 30 hops:
0 172.16.87.35
1 172.16.87.218
2 192.168.52.1
3 192.168.80.1
4 10.54.247.14
5 10.54.1.196
Computing statistics for 125 seconds...
Source to Here This Node/Link
Hop RTT Lost/Sent = Pct Lost/Sent = Pct Address
0                                       172.16.87.35
                        0/ 100 = 0%   |
1 41ms    0/ 100 = 0%     0/ 100 = 0%   172.16.87.218
                       13/ 100 = 13%  |
2 22ms   16/ 100 = 16%    3/ 100 = 3%   192.168.52.1
                        0/ 100 = 0%   |
3 24ms   13/ 100 = 13%    0/ 100 = 0%   192.168.80.1
                        0/ 100 = 0%   |
4 21ms   14/ 100 = 14%    1/ 100 = 1%   10.54.247.14
                        0/ 100 = 0%   |
5 24ms   13/ 100 = 13%    0/ 100 = 0%   10.54.1.196
Trace complete.
When pathping is run, the first results list the path. This is the same path that is shown using the tracert command. Next, a busy message is displayed for approximately 90 seconds (the time varies by hop count). During this time, information is gathered from all routers previously listed and from the links between them. At the end of this period, the test results are displayed.
In the sample report above, the This Node/Link, Lost/Sent = Pct and Address columns show that the link between 172.16.87.218 and 192.168.52.1 is dropping 13 percent of the packets. The routers at hops 2 and 4 also are dropping packets addressed to them, but this loss does not affect their ability to forward traffic that is not addressed to them.
The loss rates displayed for the links, identified as a vertical bar (|) in the Address column, indicate link congestion that is causing the loss of packets that are being forwarded on the path. The loss rates displayed for routers (identified by their IP addresses) indicate that these routers might be overloaded.
Netstat
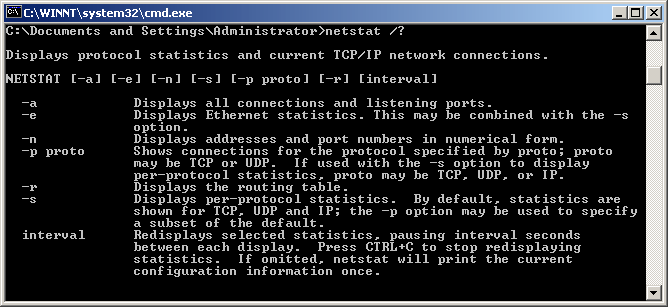
Displays active TCP connections, ports on which the computer is listening, Ethernet statistics, the IP routing table, IPv4 statistics (for the IP, ICMP, TCP, and UDP protocols), and IPv6 statistics (for the IPv6, ICMPv6, TCP over IPv6, and UDP over IPv6 protocols). Used without parameters, netstat displays active TCP connections.
Syntax
netstat [-a]
      [-e]
      [-n]
      [-o]
      [-p Protocol]
      [-r]
      [-s]
      [Interval]
Examples
To display both the Ethernet statistics and the statistics for all protocols, type the following command:
netstat -e -s
To display the statistics for only the TCP and UDP protocols, type the following command:
netstat -s -p tcp udp
To display active TCP connections and the process IDs every 5 seconds, type the following command:
netstat -o 5
To display active TCP connections and the process IDs using numerical form, type the following command:
netstat -n -o
Nbtstat
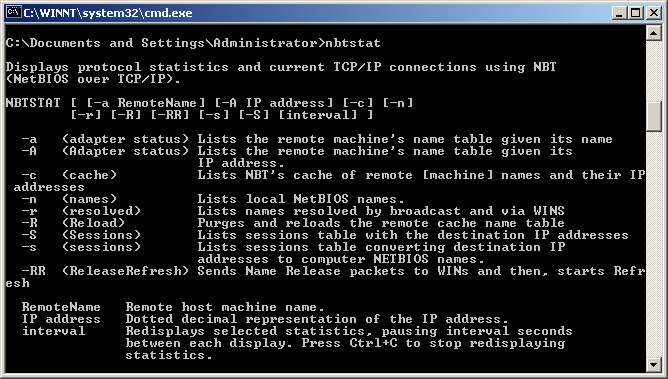
Displays NetBIOS over TCP/IP (NetBT) protocol statistics, NetBIOS name tables for both the local computer and remote computers, and the NetBIOS name cache. Nbtstat allows a refresh of the NetBIOS name cache and the names registered with Windows Internet Name Service (WINS). Used without parameters, nbtstat displays help.
Syntax
nbtstat [-a RemoteName]
      [-A IPAddress]
      [-c]
      [-n]
      [-r]
      [-R]
      [-RR]
      [-s]
      [-S]
      [Interval]
Examples
To display the NetBIOS name table of the remote computer with the NetBIOS computer name of CORP07, type:
nbtstat -a CORP07
To display the NetBIOS name table of the remote computer assigned the IP address of 10.0.0.99, type:
nbtstat -A 10.0.0.99
To display the NetBIOS name table of the local computer, type:
nbtstat -n
To display the contents of the local computer NetBIOS name cache, type:
nbtstat -c
To purge the NetBIOS name cache and reload the #PRE-tagged entries in the local Lmhosts file, type:
nbtstat -R
To release the NetBIOS names registered with the WINS server and re-register them, type:
nbtstat -RR
To display NetBIOS session statistics by IP address every five seconds, type:
nbtstat -S 5