Terminal Services Manager 26.03 preview: new UI, charts, and RDP quality metrics
Terminal Services Manager 26.03 is almost ready. Dark Mode, high-DPI, Skia-based charts, per-session RDP quality data, 130+ admin commands.
We've been working on the next version of Terminal Services Manager for over a year, and it's almost ready.
Version 26.03 is not an incremental update. The UI is new, the charting engine is new, and there's monitoring data that wasn't available before.
Dark Mode and high-DPI
The UI now switches between light and dark themes with your Windows settings. It also renders correctly on high-DPI displays.

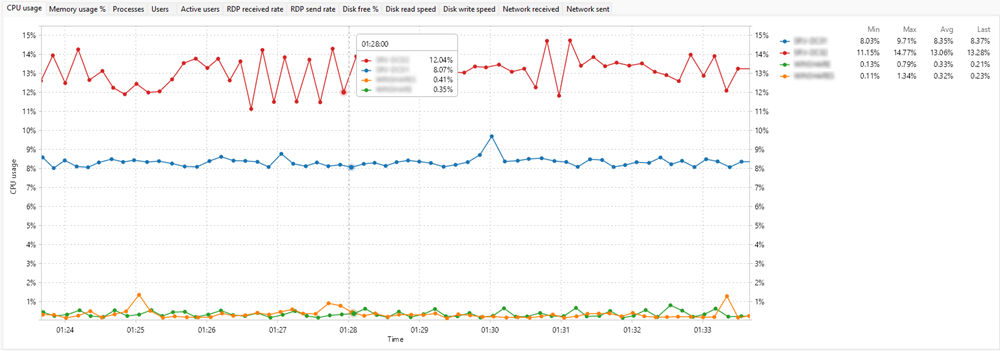
Charts built on Skia
We replaced the old charting engine. The new one is built on Skia, so charts are sharp at any scale. You can zoom, pan, measure intervals, and export to clipboard or file.
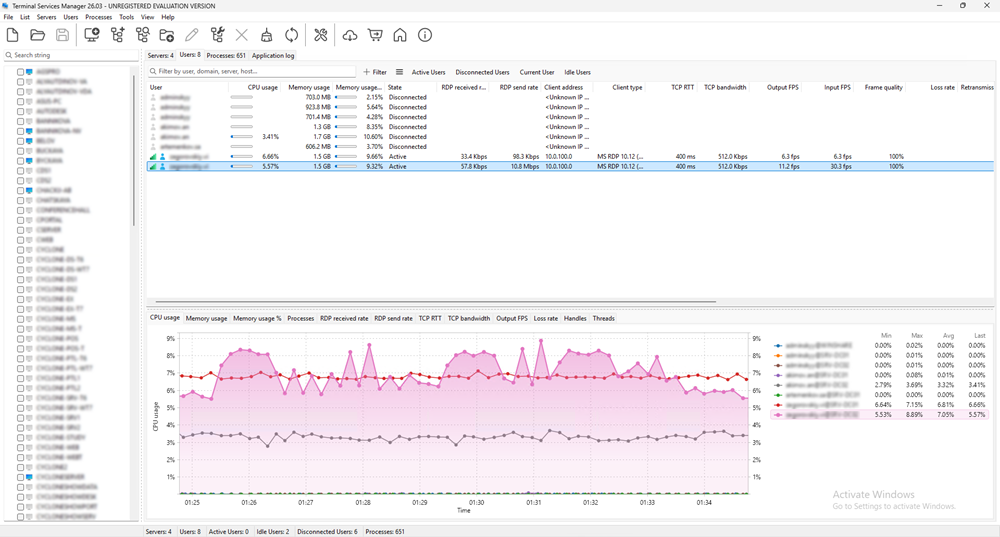
Per-session RDP connection quality
New columns show TCP round-trip time, bandwidth, frame rate, and frame quality for every active session. If a user complains about lag, you can check their connection data without leaving the app. More details in the full announcement.
Filtering, commands, languages
Multi-condition filtering now works on all three tabs (processes, users, servers). There are 130+ admin commands with variables and presets, bulk operations for computer lists, RDS licensing info, and 9 new languages (16 total).
The full release announcement is coming next week.
Want early access? If you're an active customer, check your inbox. We're sending beta invitations this week.