Explore your servers
The detail pane on the right has four tabs. Together they answer the everyday questions: which servers are healthy, who is signed in, and what is running.
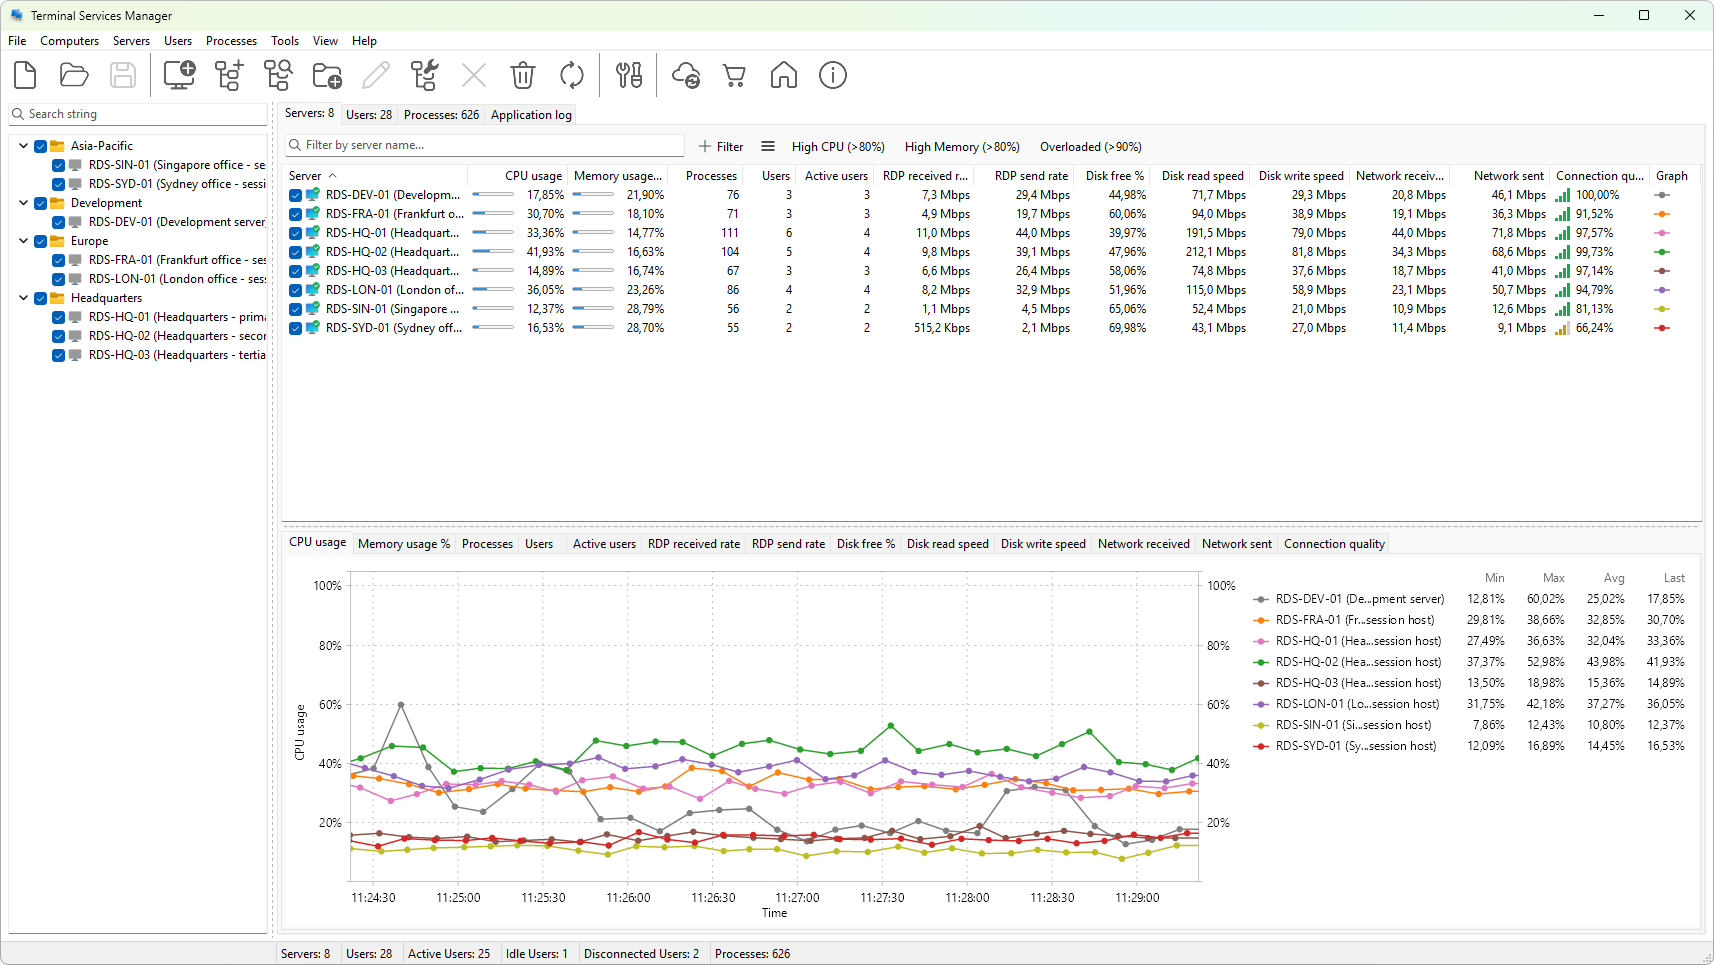
The Servers tab
The Servers tab lists every monitored host with live metrics: CPU and memory use, disk and network activity, and the number of sessions, users, and processes on each one. This is the place to spot a server that is running hot or has stopped responding.
The User sessions tab
The User sessions tab shows every session across all your servers in one list. For each session you can see the user, the server, the session state (active, idle, or disconnected), how long it has been idle, when the user logged on, and the client they connected from.
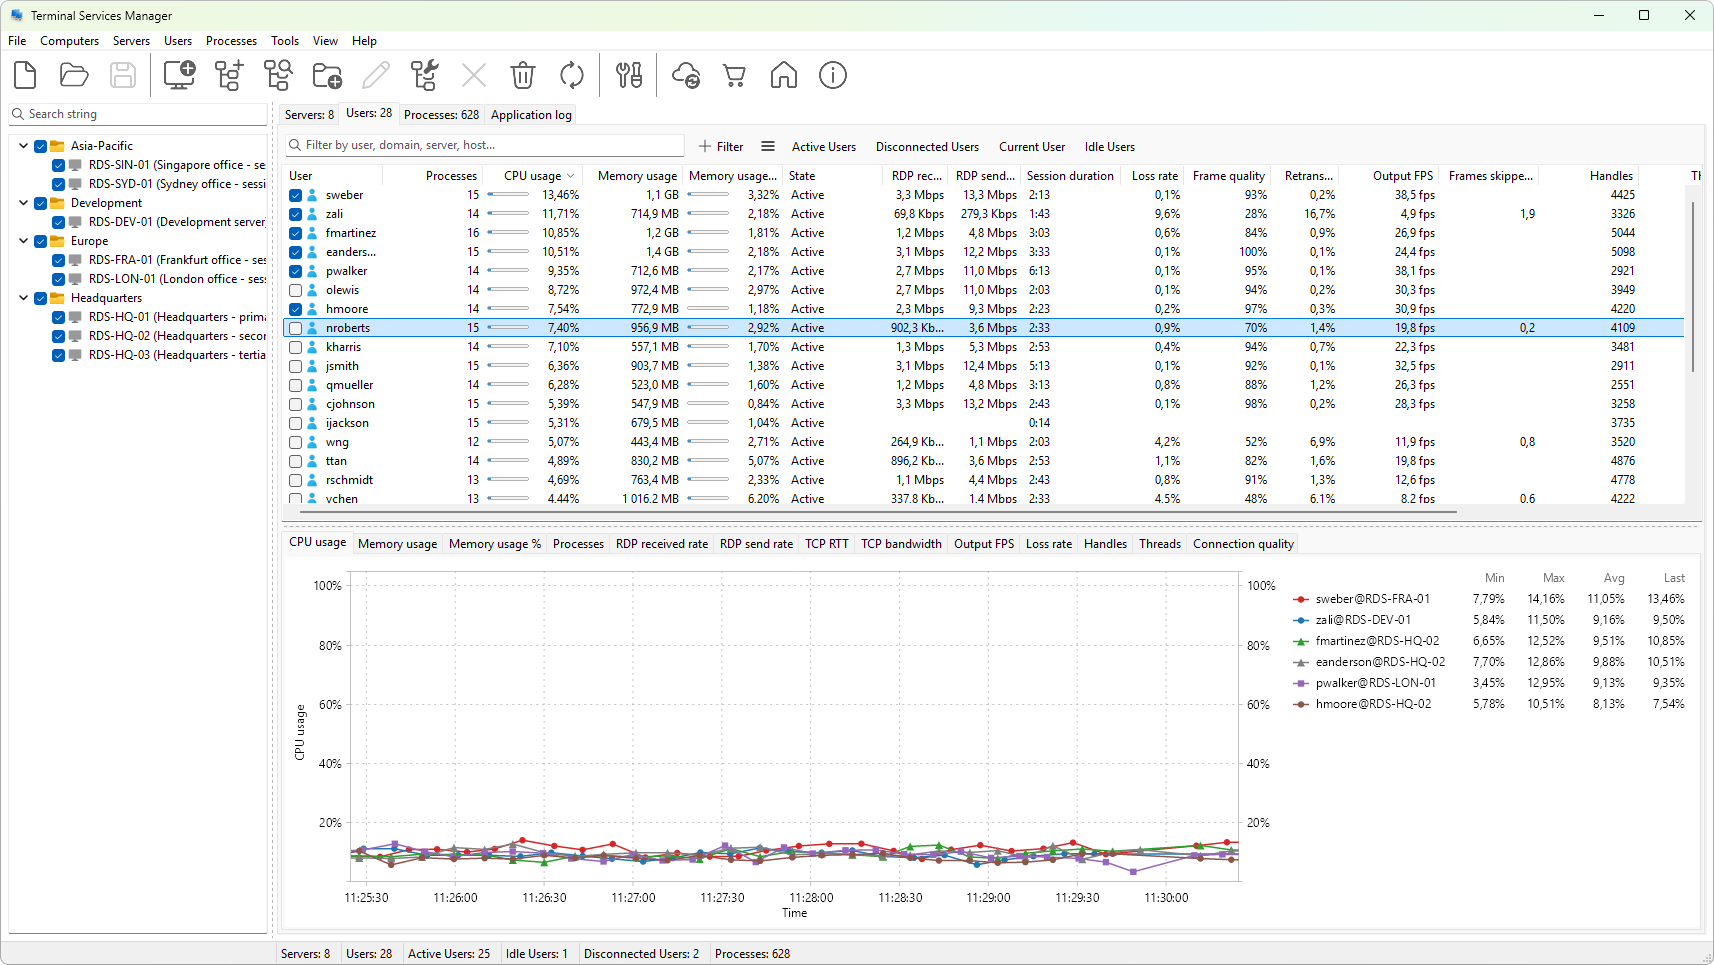
A long idle time often means a session that is holding resources but doing nothing, which is a good candidate to disconnect or log off later.
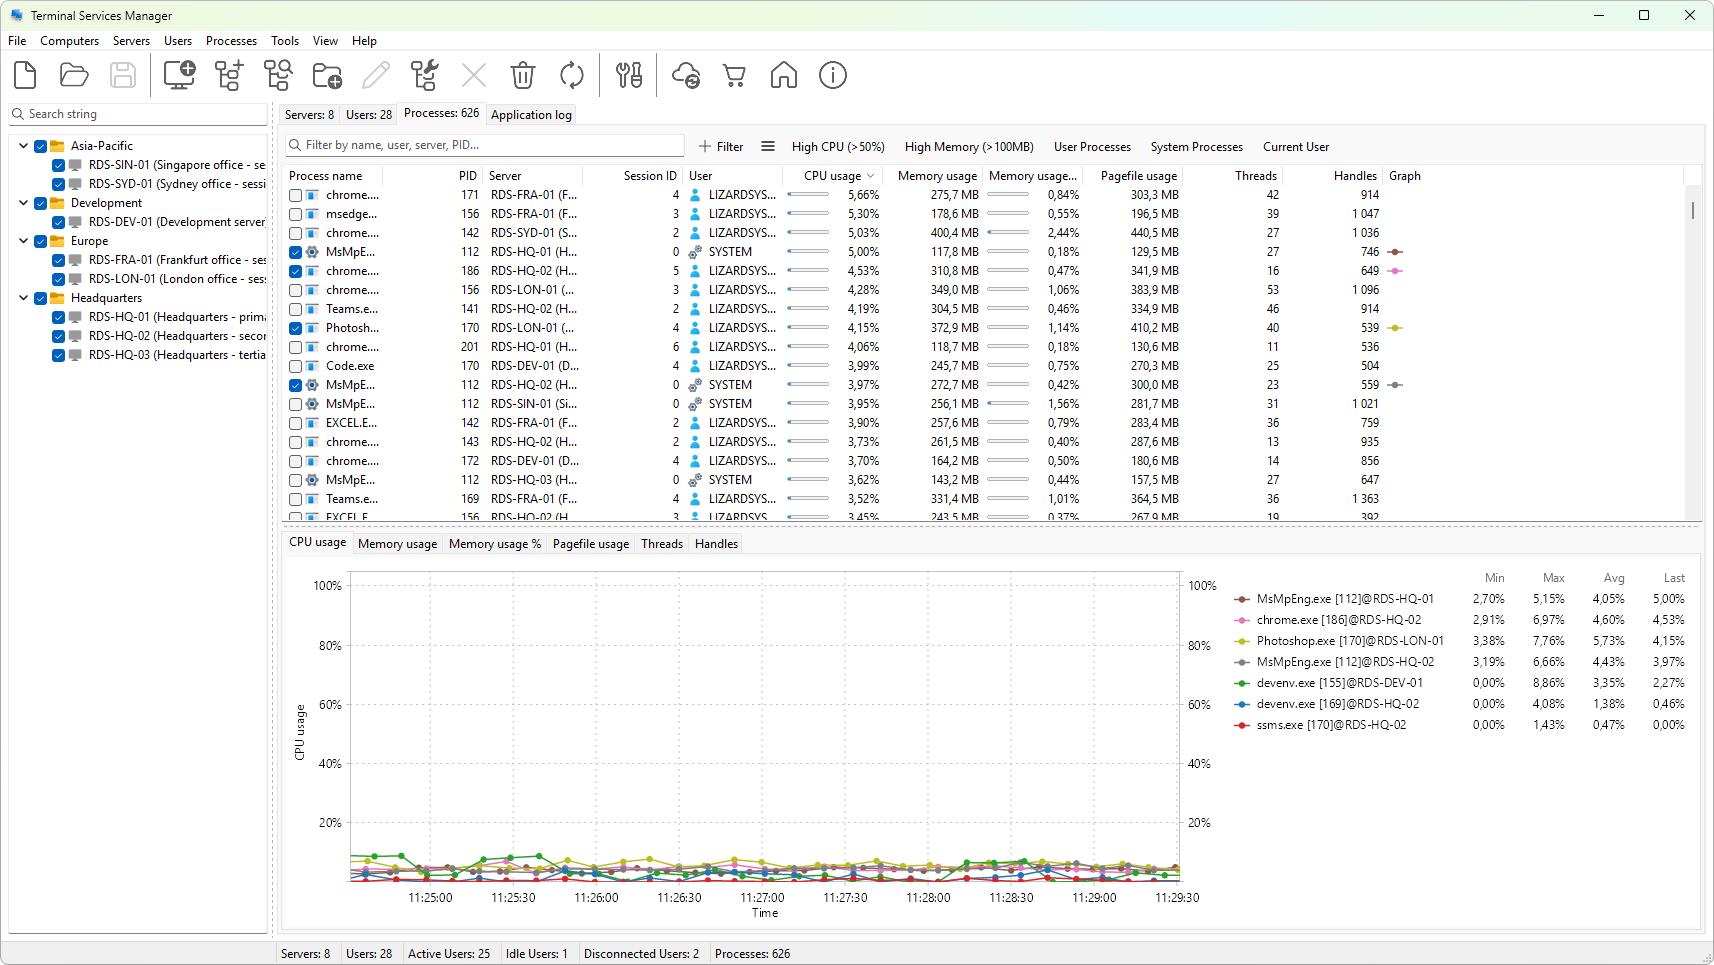
The Processes tab
The Processes tab lists the processes running inside sessions, with the user, session, CPU, and memory each one is using. Sort by CPU or memory to find a runaway process quickly.
The status bar and graphs
The status bar along the bottom keeps a running tally: total servers, total users, and how many users are active, idle, or disconnected. The graph panel under each tab plots the metrics you pick over time, so you can watch a trend instead of a single snapshot.
You now have a full picture of your servers. The last step is acting on what you see.
Next: Take your first action.