
You open the monitor to answer one question: is anything wrong right now? Summary cards answer it before you read a single row. This guide shows how to pick the cards you want and set the levels where a card turns amber and red.
The manual way: Performance Monitor alerts
Windows Performance Monitor can raise an alert when a counter crosses a value, through a data collector set of the Alert type. It works, but you create each alert counter by counter and server by server, and the result is a log entry or a task, not a figure you can see.
The faster way: summary cards in Terminal Services Manager
Terminal Services Manager shows a row of cards between each list and its charts. Each card has the current figure, its low, average, and high over the chart's time window, and a sparkline. A card turns amber when the figure reaches its warning level and red when it reaches its bad level.
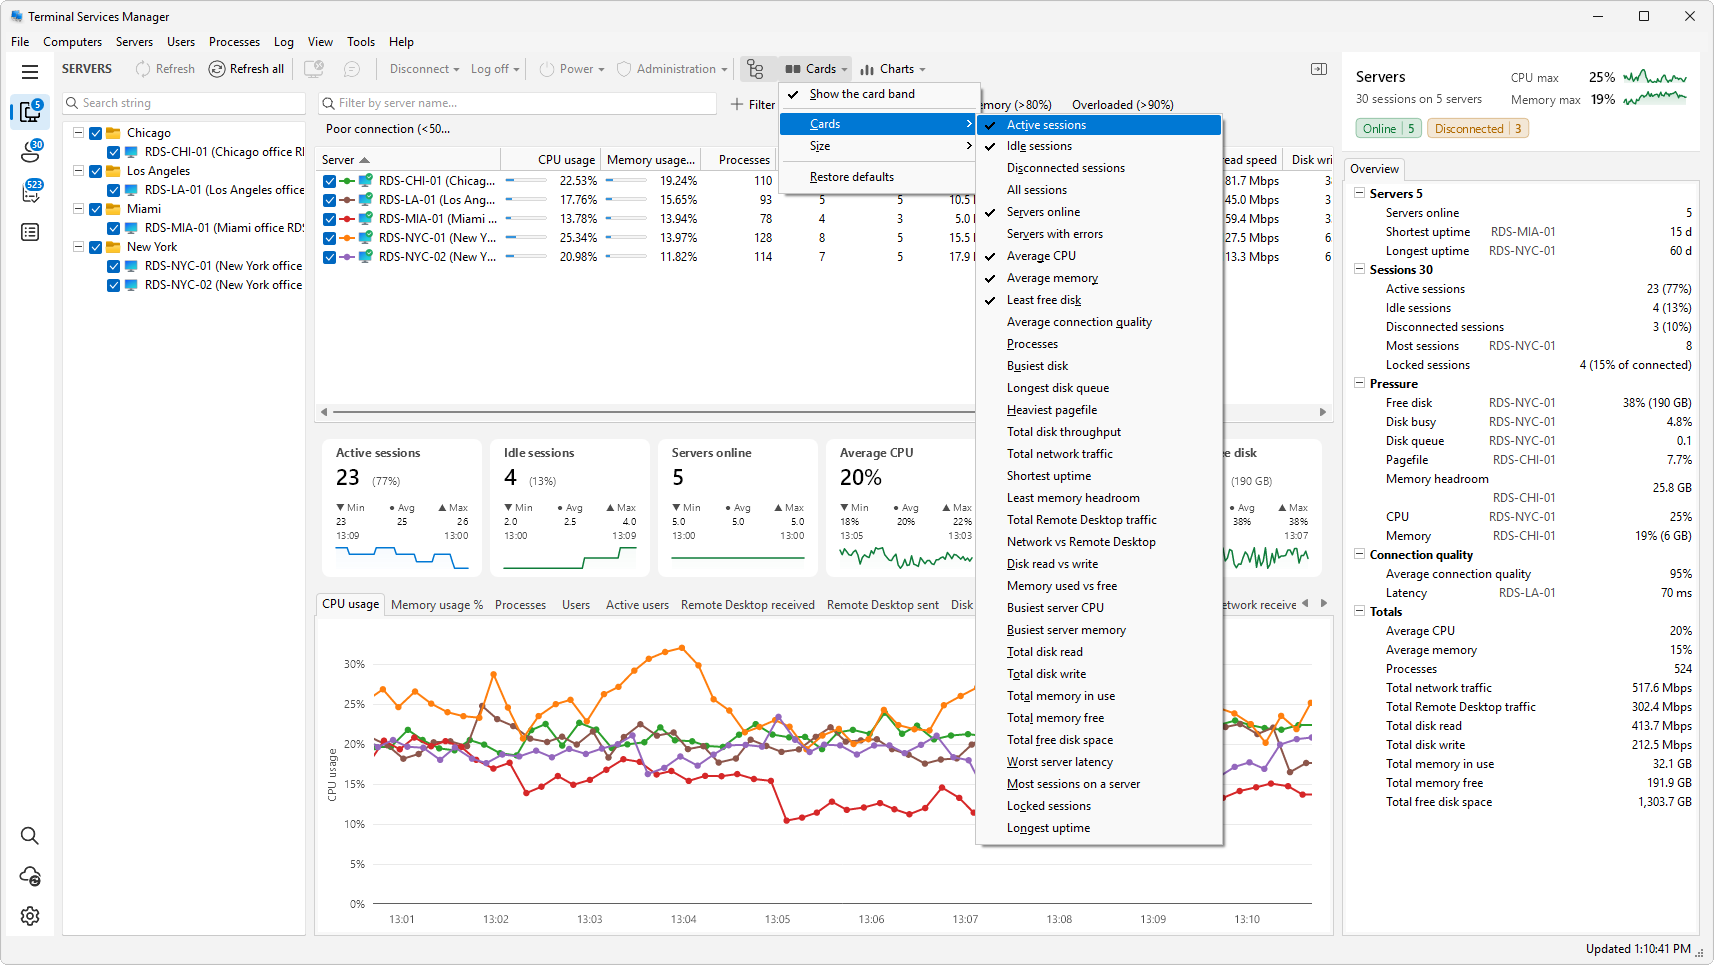
Choose the cards. Click Cards in the command row above the list.
- Show the card band shows or hides the whole row.
- Cards lists every card available for this list. Tick the ones you want.
- Size changes the size of the cards.
- Restore defaults brings back the standard cards for this list, with their order, size, and levels.
Right-clicking a card opens the same menu.
Set the levels. Open Preferences > Terminal Services > Summary cards.
- In Cards for, pick the list: Servers, User sessions, or Processes. Each list has its own cards.
- Tick the cards you want in the table and set Warning and Bad for each. A dash means the card has no level and never changes color.
- Use Move up and Move down to put the most important card first, and Card size to make the cards larger or smaller.
- Click OK.
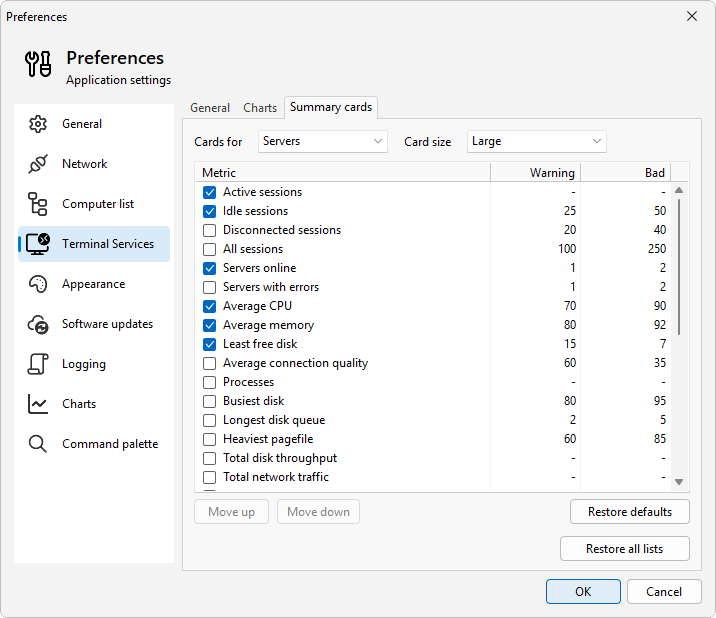
For most cards a high value is the problem: Average CPU turns amber at 70 and red at 90. For Least free disk the levels run the other way: it turns amber when free space falls to 15% and red at 7%.
Go back to the defaults. Restore defaults resets the list on screen, and Restore all lists resets all three.
Tips
- Keep four to six cards. The row is there to be read at a glance.
- Put the cards that mean something is wrong, such as Servers with errors or Poor connections, next to the ones you check every day, such as Active sessions.
- Set the warning level a little below the point where users start to complain, so the card changes color before the phone rings.