
Users say the terminal server is slow. You look at it and CPU is at 20 percent. This is the usual case where the bottleneck is somewhere else: a busy disk, a full pagefile, or no free memory.
The manual way: counters in Performance Monitor
The numbers that matter are Windows performance counters. You can read them from a command line, one server at a time:
typeperf "\LogicalDisk(_Total)\Avg. Disk Queue Length" "\Paging File(_Total)\% Usage" "\Memory\Available MBytes" -s RDSH01 -sc 5
Run it for each server and compare the output by hand. The counters are only readable if remote performance counters work on the host. If they come back empty, see the guide in the related list.
The faster way: the Pressure block in Terminal Services Manager
Terminal Services Manager reads these counters for every server and ranks the servers for you.
- Open Servers in the sidebar and click an empty area of the list so that no row is picked.
- Look at the inspector on the right. Its Pressure block names the worst server for each reading: free disk, disk busy, disk queue, pagefile, memory headroom, CPU, and memory.
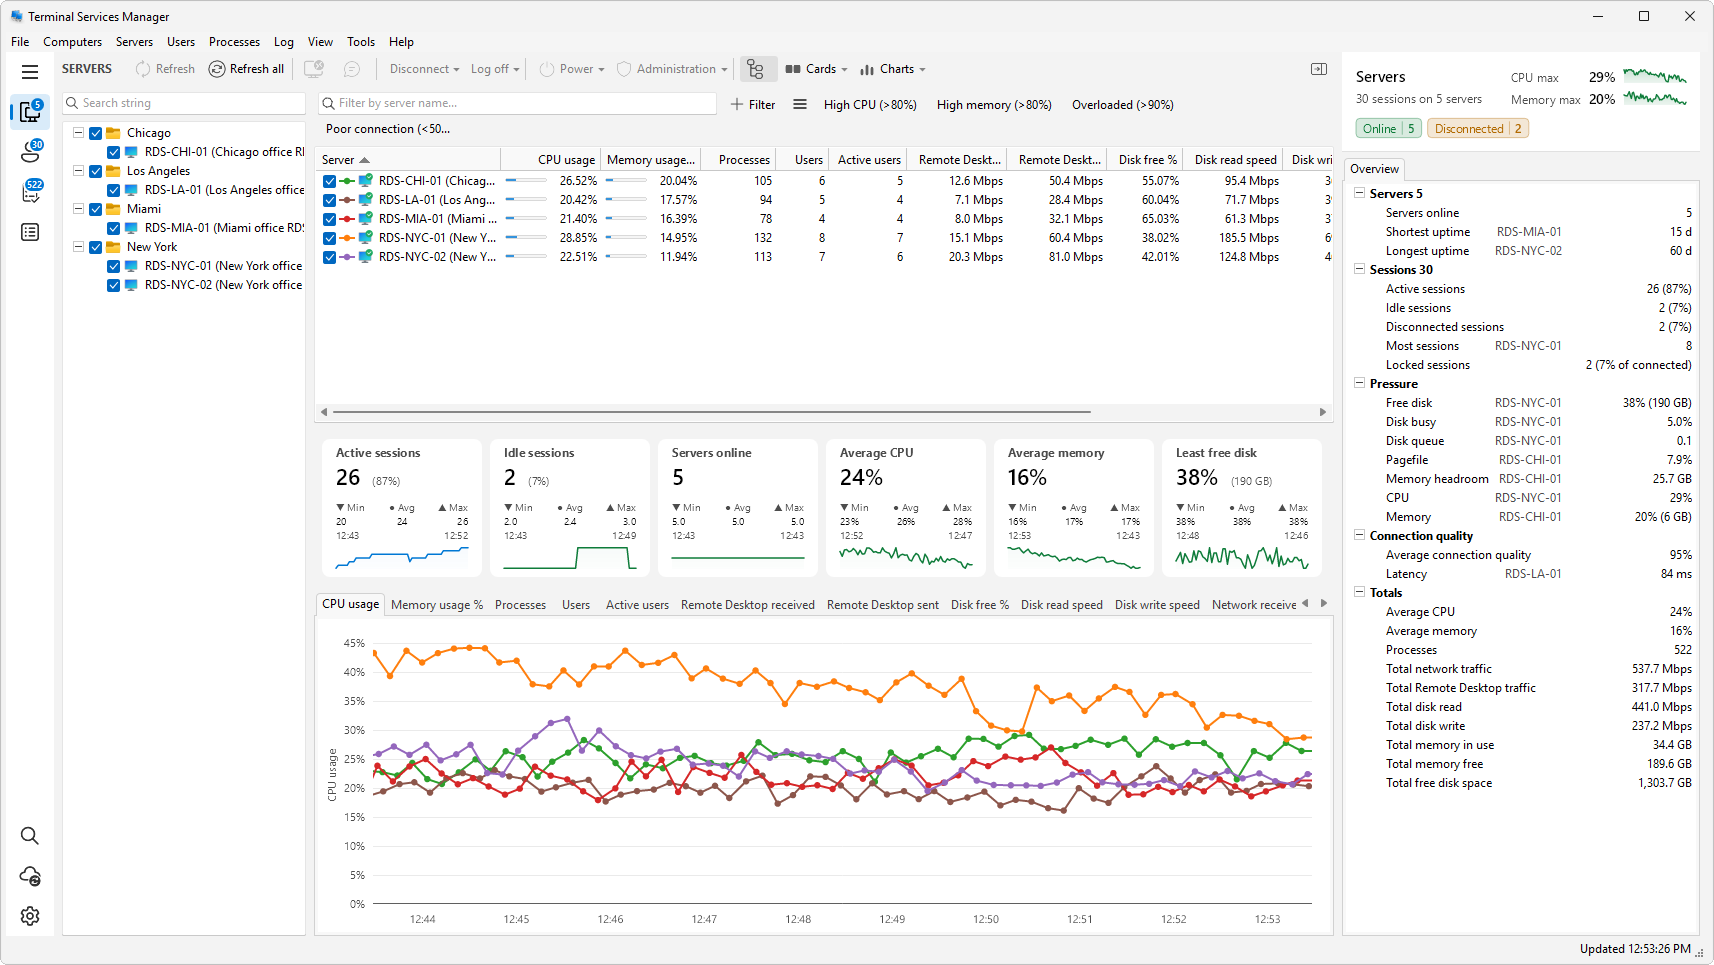
- Click that server in the list. Its Overview lists the same readings for that one server: memory total, usage, and available, pagefile usage, disk free, disk busy, disk queue length, and disk read and write speed.
- Open the charts below the list and pick Disk free %, Disk read speed, or Memory usage % to see when the pressure started.
How to read it
- Watch disk latency: an Avg. Disk sec/Transfer that stays above about 15 to 20 ms points to the disk. Terminal Services Manager shows Disk queue length and Disk busy %, so a disk queue that stays high on a busy disk is the sign. It is the most common reason for a slow logon and slow applications at the same time.
- Pagefile usage climbing together with low available memory means the host is out of RAM and is paging.
- Memory headroom is the free memory left on the server. When it gets small, one more user can push the host over the edge. By default, Windows balances only CPU time between sessions (Fair Share CPU Scheduling). Disk and network fair share exist but are off by default, and nothing balances memory.
Keep an eye on it
Add the cards Longest disk queue, Heaviest pagefile, Busiest disk, and Least memory headroom to the summary row under the Cards button. They turn amber and red at levels you can change, so you see the pressure before users report it.
What to do next
Open Processes, sort by memory or by handles, and find the user whose session is the heaviest. Then message the user or end the task.
Related
- How to find which user is using high CPU on an RDS host
- How to fix missing CPU, memory, and disk usage for remote RDS servers
- How to set up summary cards and the levels where they turn amber and red