Terminal Services Manager reads CPU, memory, and disk usage from Windows performance counters (PDH) on each monitored server. These counters require the Remote Registry service to be running on the remote machine. If the service is stopped or disabled, the columns stay empty or show 0%.
What it looks like
The Servers tab still shows session and user counts, but the CPU usage, Memory usage, and disk speed columns (Disk read speed, Disk write speed) are empty or zero, and the matching dashboard graphs stay flat. Session and process listings keep working. The same gaps show up on the User sessions tab.
Check Remote Registry on the remote server
Open a command prompt or PowerShell on your workstation and run:
sc \\SERVER query RemoteRegistry
Replace SERVER with the actual server name. For example:
sc \\rdsh01 query RemoteRegistry
If the service is running, you'll see:
STATE : 4 RUNNING
If it shows STOPPED, that's the problem.
Start Remote Registry
Start the service:
sc \\SERVER start RemoteRegistry
If the command fails with "Access is denied", run the terminal as Administrator.
If it fails with "The service cannot be started" because the startup type is Disabled, change it to Manual first (note the space after start=):
sc \\SERVER config RemoteRegistry start= demand
sc \\SERVER start RemoteRegistry
With Manual (demand) startup, Windows starts the service automatically when Terminal Services Manager requests counter data. You don't need to set it to Automatic.
Check with PowerShell
If you prefer PowerShell, or need to check multiple servers at once:
# Single server
Get-Service -Name RemoteRegistry -ComputerName rdsh01
# Multiple servers
$servers = @("rdsh01", "rdsh02", "rdsh03")
foreach ($server in $servers) {
    $svc = Get-Service -Name RemoteRegistry -ComputerName $server
    Write-Host "$server - $($svc.Status) ($($svc.StartType))"
}
Start Remote Registry on all servers where it's stopped:
$servers = @("rdsh01", "rdsh02", "rdsh03")
foreach ($server in $servers) {
    $svc = Get-Service -Name RemoteRegistry -ComputerName $server
    if ($svc.Status -ne 'Running') {
        Set-Service -Name RemoteRegistry -ComputerName $server -StartupType Manual
        Start-Service -InputObject (Get-Service -Name RemoteRegistry -ComputerName $server)
        Write-Host "$server - started"
    } else {
        Write-Host "$server - already running"
    }
}
Check with Group Policy
If Remote Registry is disabled across your environment by Group Policy, you may need to create an exception for the servers you want to monitor.
- Open Group Policy Management and find the policy that disables Remote Registry
- Add an exception for your RDS servers, or create a separate GPO that sets the Remote Registry startup type to Manual
- Run
gpupdate /forceon the affected servers
Firewall requirements
Remote Registry uses RPC, which requires these ports to be open between your workstation and the monitored servers:
- TCP 135 (RPC Endpoint Mapper)
- TCP 49152-65535 (dynamic RPC range)
If your environment uses a restricted firewall, enable the predefined Windows Firewall rule:
netsh advfirewall firewall set rule group="Remote Service Management" new enable=yes
Or through PowerShell:
Enable-NetFirewallRule -DisplayGroup "Remote Service Management"
Enable debug logging
Terminal Services Manager logs PDH errors when counters fail to load. File logging is off by default. To enable it:
- Go to File > Preferences
- Select Logging in the left panel
- Check Enable file logging
- Under File logging, set Minimum level to Debug (this is a separate setting from the General minimum level above it)
- Click OK
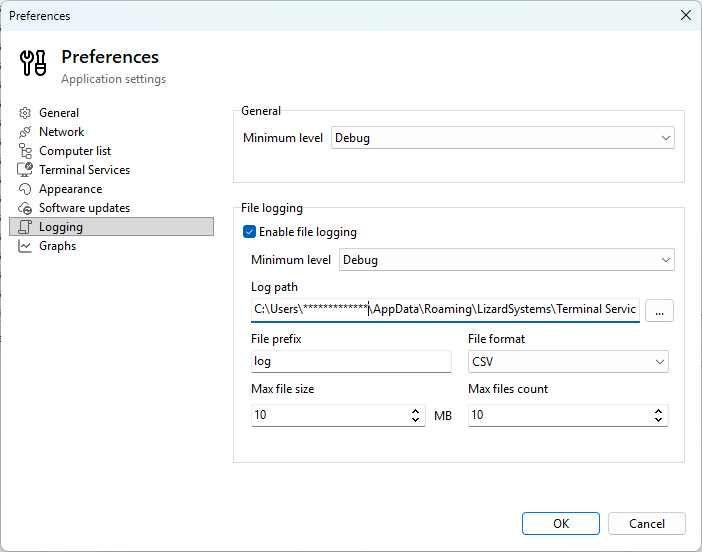
Let the servers refresh for a full monitoring cycle (1-2 minutes), then open the log file. The folder is shown in the Log path field on the same page; by default it is:
%APPDATA%\LizardSystems\Terminal Services Manager\Logs\
That expands to C:\Users\<you>\AppData\Roaming\LizardSystems\Terminal Services Manager\Logs\. Log files are named log_YYYYMMDD.csv (for example, log_20260411.csv). Open the latest one and search for lines containing "PDH". You can also watch the same errors live on the Application log tab inside the program, without opening the file.
If the log mentions "Remote Registry", the service is not reachable on that server. If it mentions "Object not found" or error code 0xC0000BB8, the counter registration failed.
Still not working?
If Remote Registry is running and you still see empty columns:
- Slow network. If
sc \\SERVER query RemoteRegistrytakes more than a few seconds to respond, the PDH connection may be timing out. Check network latency between your workstation and the servers. - WMI/RPC issues. Try restarting the Remote Registry service on the server:
sc \\SERVER stop RemoteRegistry && sc \\SERVER start RemoteRegistry - Permissions. Your account needs administrative access on the remote server to read performance counters. If it does not, run the program under an account that does.
- Send us the logs. Enable debug logging (see above), let the servers refresh, and email the log CSV from
%APPDATA%\LizardSystems\Terminal Services Manager\Logs\to support@lizardsystems.com. Include which servers show the problem and which don't.
Related
- How to find which user is using high CPU on an RDS host
- How to add your RDS servers and connect with the right account