The User sessions tab
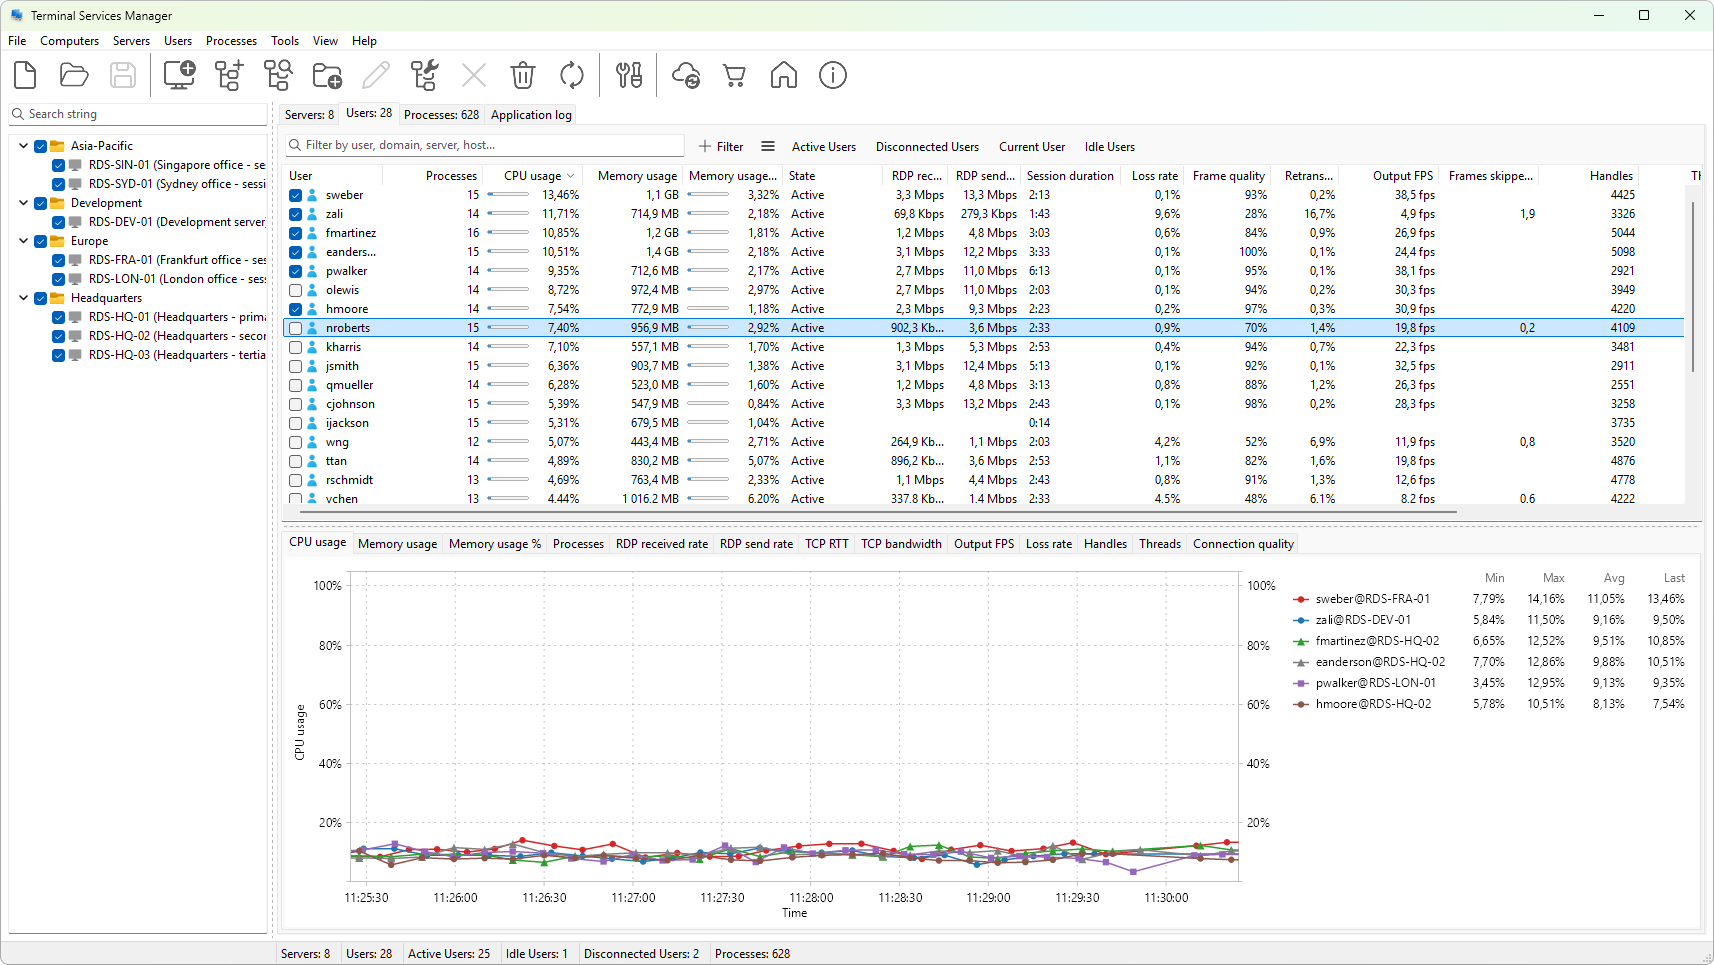
The User sessions tab is the second tab in the right-hand pane. Each row is one user session on one server. The 44 available columns cover identity, performance, RDP connection quality, client information, session timing, and a per-session sparkline graph.
Layout
- Row - one session. Multiple sessions of the same user on different servers are listed as separate rows.
- Header - click a column heading to sort by it. Right-click for the column-header menu.
- Splitter - a horizontal bar between the session tree and the graph panel below it. Drag to resize.
Status icons
The leftmost column shows the session state:
- A green icon means the session is active (the user is connected and interacting with it).
- A gray icon means the session is disconnected (the user closed the client but the session is still on the server).
- A red icon means a problem state (reset in progress, listening, init, idle exceeding the limit).
Hover the icon for the exact state string.
Selection
- Click to select a session. The graph panel below redraws for that session.
Ctrl+clickorShift+clickextends the selection. Actions apply to every selected session.- The checkbox at the start of each row is independent of selection.
See also
Was this page helpful?
Thanks for your feedback.