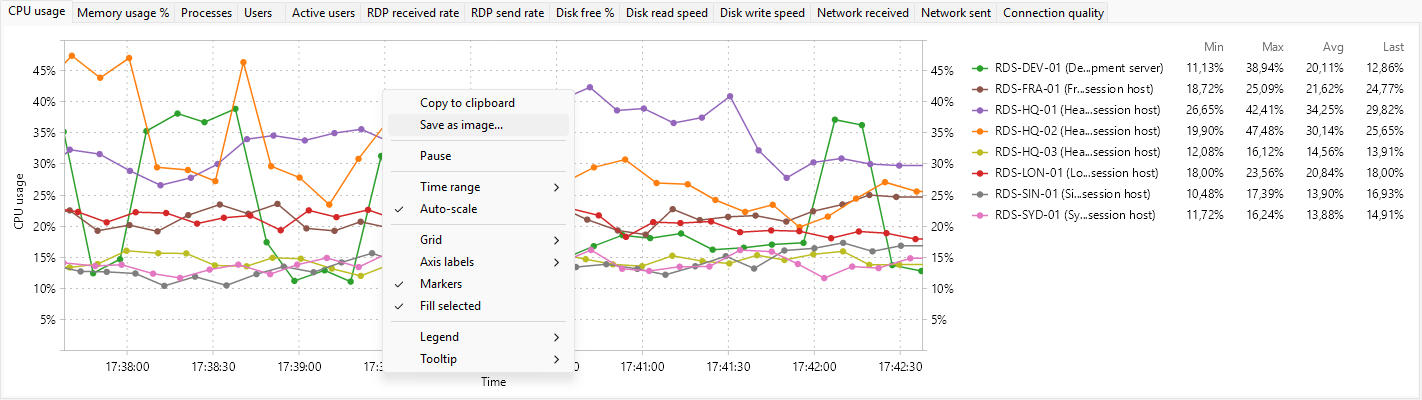
The Servers tab graph panel can plot any of these 26 metrics over time. Each metric is also a column on the tab; see Server metrics reference for what each one measures. The Default column says whether the metric appears in the panel out of the box. The matching panels for the other tabs are covered in the user session metric graphs reference and the process metric graphs reference.
System
| Metric |
Unit |
Default |
| CPU usage |
% |
shown |
| Memory usage |
MB |
hidden |
| Memory usage % |
% |
shown |
| Available memory |
MB |
hidden |
Sessions and users
| Metric |
Unit |
Default |
| Processes |
count |
shown |
| Sessions |
count |
hidden |
| Users |
count |
shown |
| Active users |
count |
shown |
| Idle users |
count |
hidden |
| Disconnected users |
count |
hidden |
RDP traffic
| Metric |
Unit |
Default |
| RDP received rate |
B/s |
shown |
| RDP send rate |
B/s |
shown |
Disk
| Metric |
Unit |
Default |
| Disk free % |
% |
shown |
| Disk free |
MB |
hidden |
| Disk read speed |
B/s |
shown |
| Disk write speed |
B/s |
shown |
| Disk busy % |
% |
hidden |
| Disk queue length |
count |
hidden |
Network
| Metric |
Unit |
Default |
| Network received |
B/s |
shown |
| Network sent |
B/s |
shown |
Memory
| Metric |
Unit |
Default |
| Pagefile usage % |
% |
hidden |
RDP quality (averaged across sessions)
| Metric |
Unit |
Default |
| Avg TCP RTT |
ms |
hidden |
| Avg output FPS |
fps |
hidden |
| Avg input FPS |
fps |
hidden |
| Avg frame quality |
% |
hidden |
| Connection quality |
% |
shown |