Process metric graphs reference
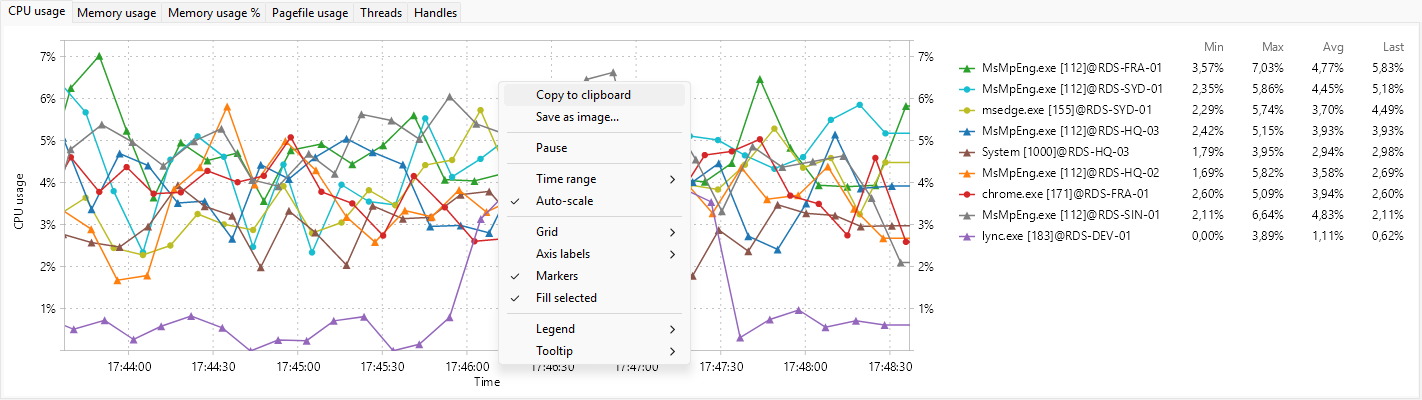
The Processes tab graph panel can plot any of these 6 metrics. See Process metrics reference for what each one measures. The matching panels for the other tabs are covered in the server metric graphs reference and the user session metric graphs reference.
| Metric | Unit | Default |
|---|---|---|
| CPU usage | % | shown |
| Memory usage | MB | shown |
| Memory usage % | % | shown |
| Pagefile usage | MB | shown |
| Threads | count | shown |
| Handles | count | shown |
Every available process metric is on by default; the process panel is the most compact of the three.
Was this page helpful?
Thanks for your feedback.