Entity details
The Details dialog shows every metric the program tracks for one selected server, user session, or process, plus a chart for the focused metric. Use it when one column on the main grid isn't enough and you want every number for one entity in one place.
How to open it
- Double-click a row on any data tab, or
- Right-click a row and choose Details... (the last item on the context menu).
The dialog opens with the entity already loaded.
Layout
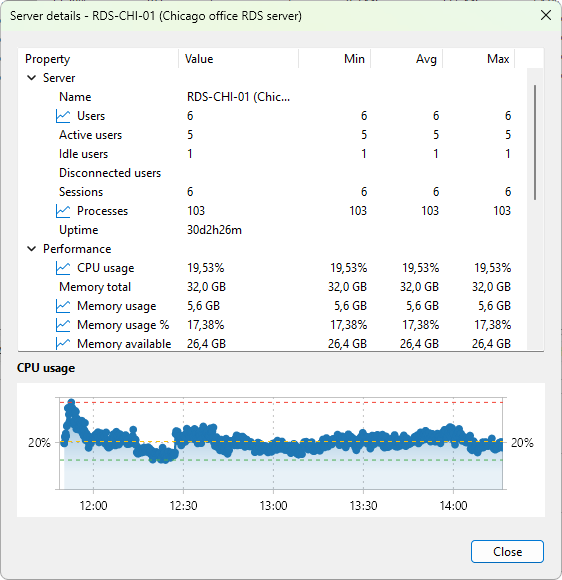
The top half is a property tree with five columns:
- Property - the metric name, grouped under category nodes.
- Value - the current value.
- Min / Avg / Max - running statistics for numeric metrics, computed over the graph time range.
Below the tree is a chart label and a chart panel that plots the focused metric over time, much like the graph panel on the monitoring tabs. Click a property row to switch the chart to that metric (when one is available).
What it shows
The category list depends on the entity type. Each category groups related properties; numeric properties show Min, Avg, and Max alongside the current value.
Server
- Server - Name, Users, Active users, Idle users, Disconnected users, Sessions, Processes, Uptime.
- Performance - CPU usage, Memory total, Memory usage, Memory usage %, Memory available, Pagefile usage %.
- Disk - Disk free %, Disk free, Disk busy %, Disk queue length, Disk read speed, Disk write speed.
- Network - RDP received rate, RDP send rate, Network received, Network sent, Avg TCP RTT, Avg output FPS, Avg input FPS, Avg frame quality.
User session
- Session - User, Domain, Session ID, Session, State, Server, Host, Farm.
- Client - Client name, Client address, Client build, Client display, Client directory, Work directory, Initial program.
- Timing - Logon time, Connect time, Disconnect time, Last input time, Idle time, Session duration, Connected time.
- Performance - CPU usage, Memory usage, Memory usage %, Processes, Handles, Threads.
- RDP - RDP received rate, RDP send rate, TCP RTT, TCP bandwidth, Output FPS, Input FPS, Frame quality, Loss rate, Retransmission rate, FEC rate, Frames skipped (client), Frames skipped (network), Frames skipped (server), Encoding time.
Process
- Process - Name, PID, Server, Session ID, User, User SID.
- Performance - CPU usage, CPU time, Memory usage, Memory usage %, Peak memory, Pagefile usage, Peak pagefile, Threads, Handles.
For full descriptions of each metric, see the matching reference: Server metrics reference, User session metrics reference, Process metrics reference.
Refresh
The dialog updates the visible values on a one-second timer and redraws the chart roughly every 250 ms. The underlying samples are collected at the same interval as the main grid (see Refreshing server data).
What it doesn't do
The dialog is read-only. To act on the entity (send a message, kill a process, reset a session) use the action from the row's context menu first.
If the entity disappears while the dialog is open (process exits, session ends, server drops), the dialog detaches: the chart freezes at the last sample and values stop updating. Close the dialog when you're done.