Managing processes
The Processes tab lists every process running on every server in your list. Each row is one process on one server in one session, so you can see at a glance who owns what and how much it is consuming. When a server slows down, this is where you find the cause: sort by CPU or memory to surface the heaviest process, check the user session that owns it, and stop it if you need to.
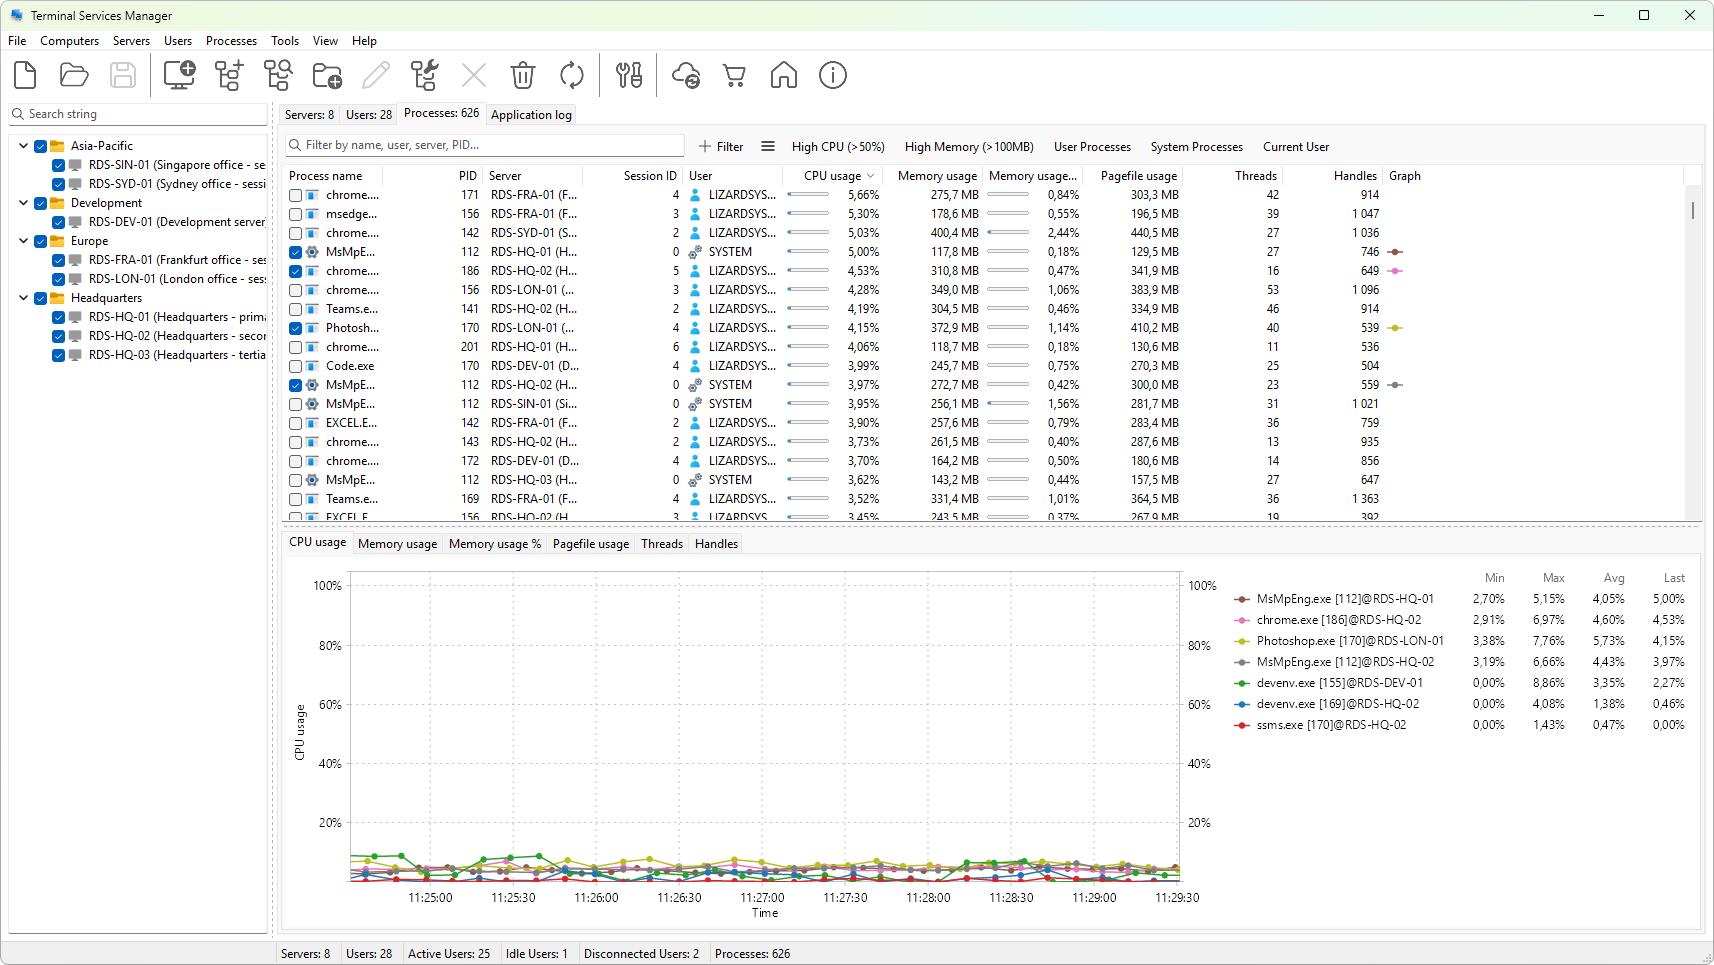
The tab shows 15 data columns plus a graph column, covering process identity, CPU and memory use, threads, and handles. You decide which columns appear and in what order, and you can plot the graphable metrics on a chart. A filter strip above the tree narrows the list to the processes you care about, and the context menu gives you the actions: terminate, copy details, jump to the owning session, and more.
This section walks through the tab itself, the full metrics reference, how to terminate a process, filtering, column layout, exporting to the clipboard or a CSV file, and the context menu.