User session metrics reference
Every column on the User sessions tab is listed below. Use Configuring user columns to choose which ones you see.
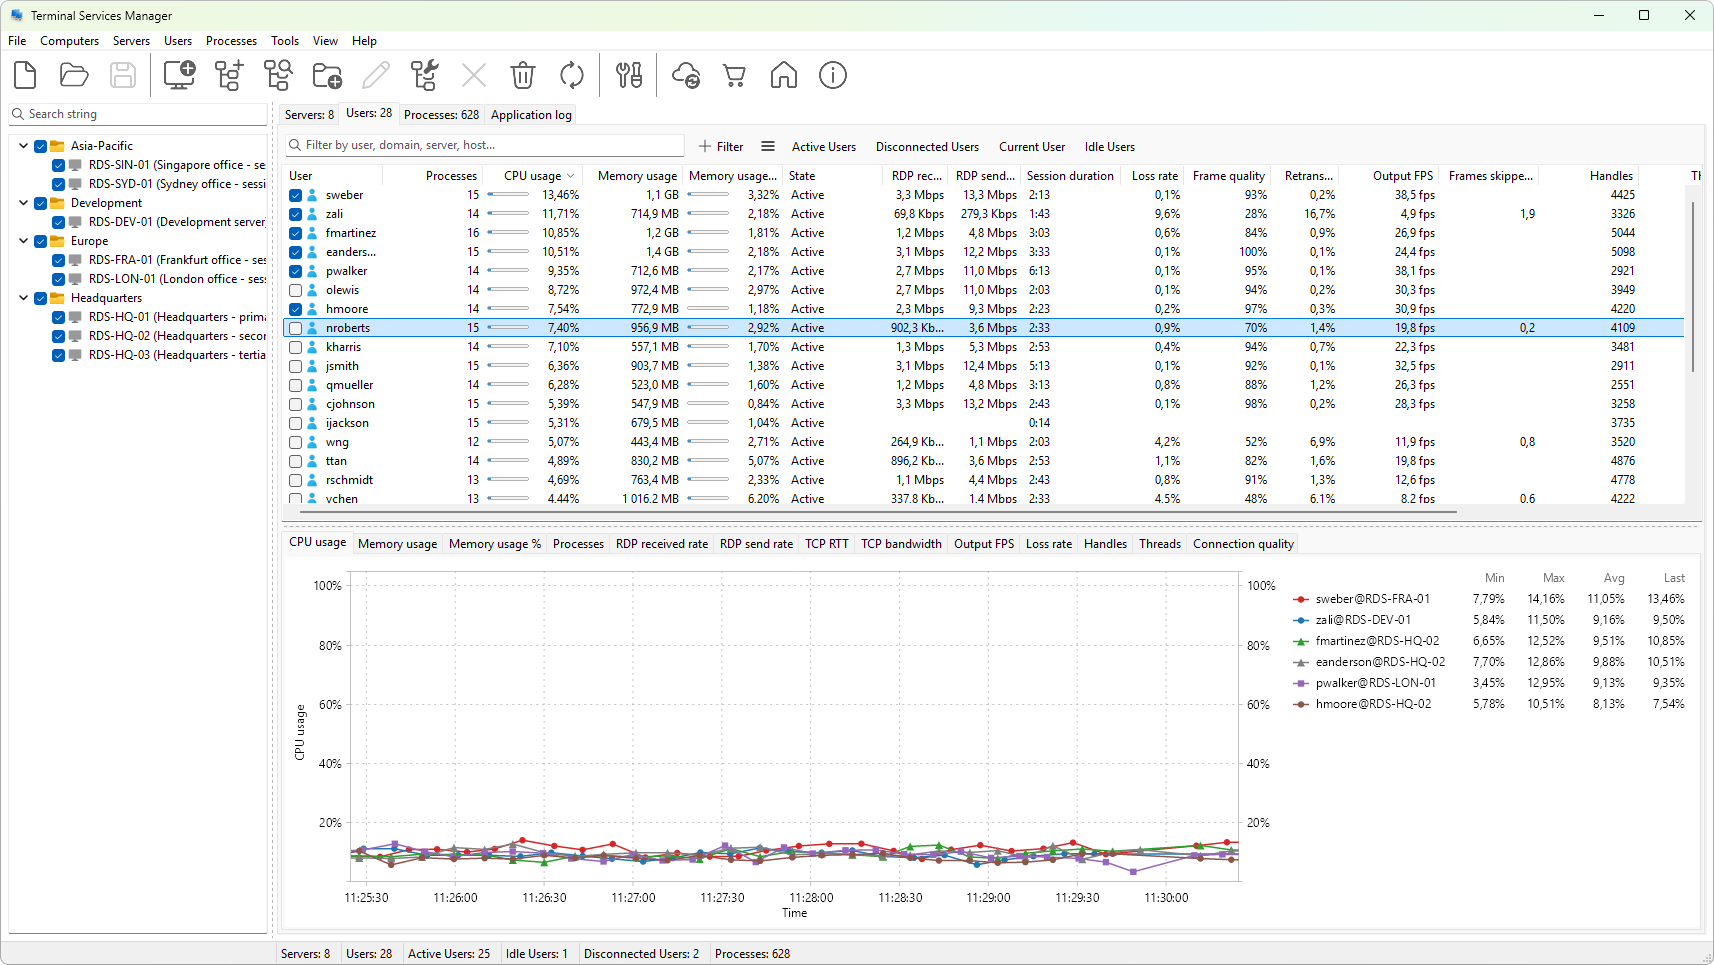
Metrics tagged (graphable) can also be plotted on a chart from the graph panel; see User session metric graphs reference for the full list and Choosing which metrics to graph for how to pick one.
Identity
- User - the login name. For local accounts, the bare user name; for domain accounts, just the user name (the domain is in the next column).
- Domain - the domain or computer that authenticated the account.
- Server - the server the session is on.
- Host / Farm - the RDS session host and the deployment name, when the server is part of an RDS farm.
Session
- Session ID - the numeric session ID on the server. Session 0 is the services session; 1 is normally the console.
- Session - the WinStation name (
RDP-Tcp#N,Console,services). - State - active, disconnected, idle, listening, init, reset, down, shadow, conn, conn query, others.
CPU and memory
- CPU usage (graphable) - percentage of total CPU time consumed by every process in the session during the last refresh interval.
- Memory usage (graphable) - working set across all processes, in megabytes.
- Memory usage % (graphable) - working set as a percentage of installed RAM.
- Processes (graphable) - number of processes running in the session.
- Handles (graphable) - total OS handles open across the session's processes.
- Threads (graphable) - total threads.
Session timing
- Logon time - when the session was created.
- Connect time - when the user most recently connected to the session.
- Disconnect time - when the user most recently disconnected.
- Last input time - when input was last received from the client.
- Idle time - elapsed time since the last input.
- Session duration - elapsed time since logon, regardless of connect state.
- Connected time - elapsed time since the most recent connect.
RDP traffic
- RDP received rate (graphable) - bytes per second from the client into the server on this session.
- RDP send rate (graphable) - bytes per second from the server to the client.
RDP connection quality
Reported by the RDP stack for this session. Values are blank when the session is disconnected.
- TCP RTT (graphable) - latency between client and server in milliseconds.
- TCP bandwidth (graphable) - bytes per second of available bandwidth as estimated by the stack.
- Output FPS (graphable) - frames sent to the client per second.
- Input FPS (graphable) - frames received from the client per second.
- Frame quality (graphable) - average compression quality. Lower values mean more aggressive compression.
- Loss rate (graphable) - packet loss percentage.
- Retransmission rate (graphable) - percentage of packets retransmitted.
- FEC rate (graphable) - forward error correction overhead percentage.
- Frames skipped (client) (graphable) - frames the client could not render in time.
- Frames skipped (network) (graphable) - frames dropped on the wire.
- Frames skipped (server) (graphable) - frames the server skipped before sending.
- Encoding time (graphable) - milliseconds spent encoding the last frame batch.
- Connection quality (graphable) - overall grade combining latency, loss, and bandwidth.
Client
- Client name - the host name reported by the client.
- Client address - the IPv4 or IPv6 address the client connected from.
- Client type - a derived RDP and OS version string for the client (for example, "RDP 8.1, Windows 8.1 / Server 2012 R2").
- Client display - the client's display resolution and color depth.
- Client directory - the install path of the client (when reported).
- Work directory - the working directory configured for the session.
- Initial program - the program configured to run on logon, when set.
Graph column
- Graph - a sparkline of the metric you have chosen for this session.
See also
- User session metric graphs reference - the 21 metrics that can be plotted on the user-session graph, with units and defaults.
Notes
- Sessions on servers that fail to refresh do not show up here. They appear when the next refresh succeeds.
- Performance metrics that depend on PDH counters (CPU, memory percent, handles, threads) need the Remote Registry service running on the server.
Was this page helpful?
Thanks for your feedback.