The Servers tab
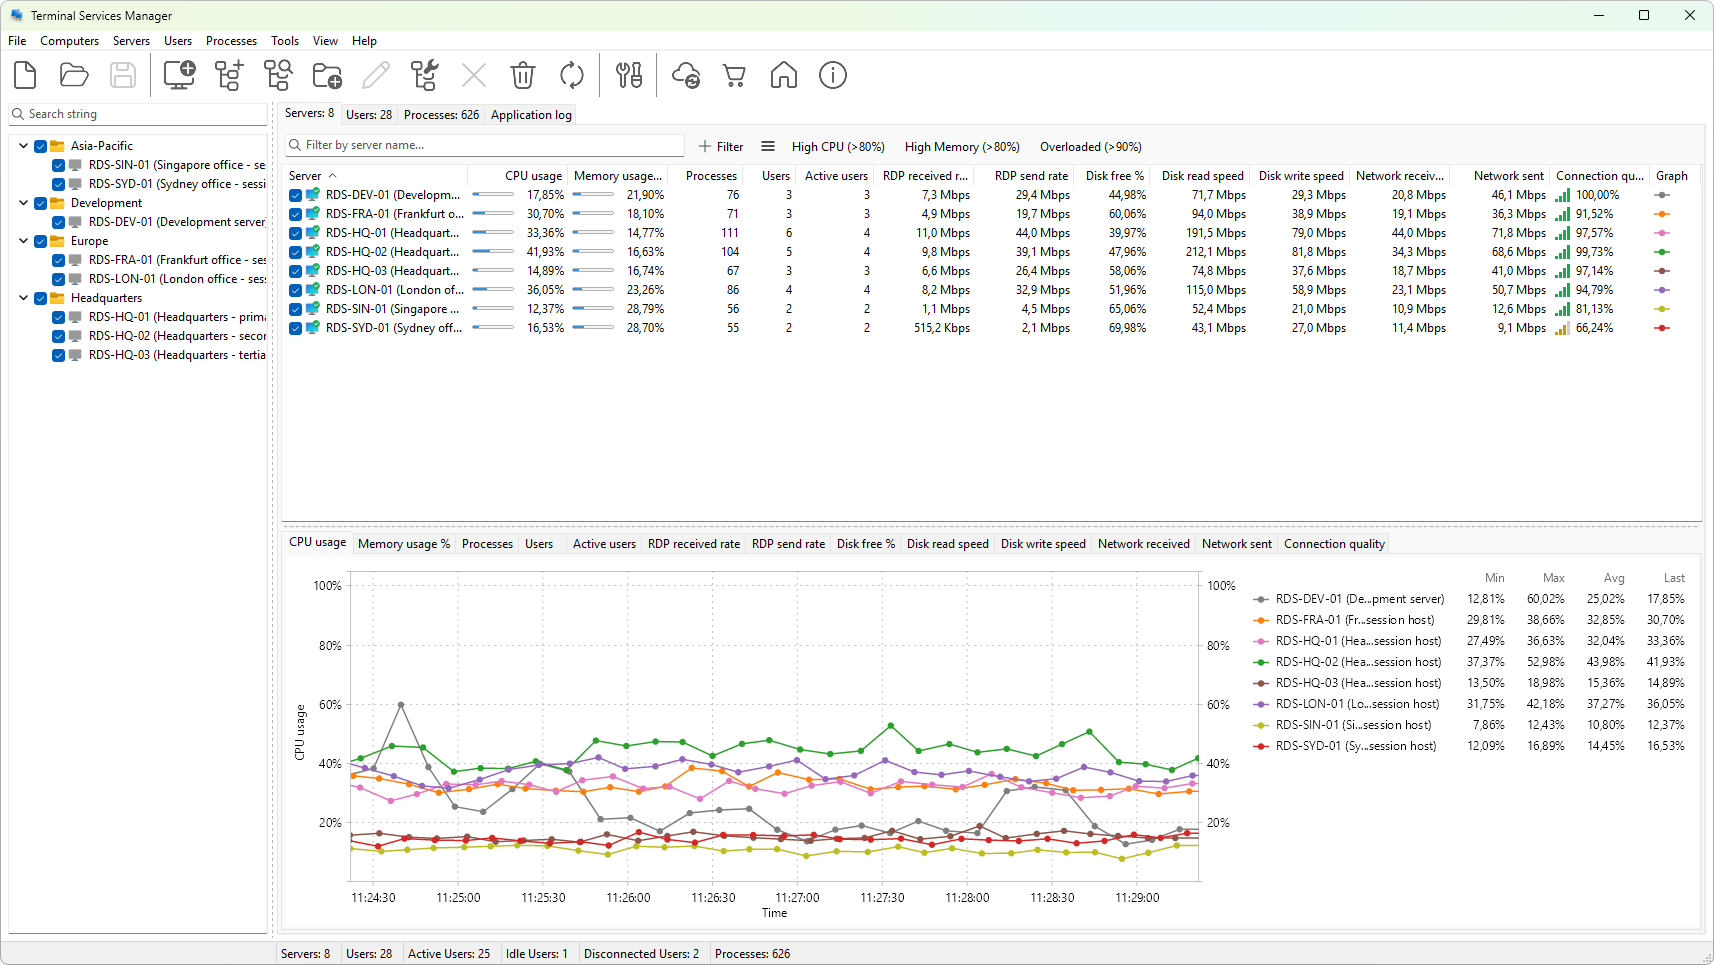
The Servers tab lives on the right-hand pane of the main window. It shows one row per server in your computer list, with live performance and session counters across 29 columns.
Layout
- Row - one Remote Desktop Services host. The leftmost column shows its name and description; the remaining columns show metrics that update on a timer.
- Header - click a column heading to sort by that column; click again to reverse the sort order. Right-click any heading to open the column header menu, where you can show or hide a column or open the column settings dialog.
- Splitter - a horizontal bar separates the server tree from the graph panel below it. Drag the bar to give more space to either pane.
Status icons
The name column shows a small icon next to each server. A colored icon means the last refresh succeeded; a greyed-out icon means the server is unreachable. Hover the row to see the last error.
A computer that is not a Remote Desktop Services host (for example, a workstation listed for inventory) reports its session and process counts as zero and most metrics stay blank. Use Configure Remote Desktop from the context menu to turn a machine into an RDS host.
Selection
- Click a row to select that server. The graph panel below redraws to show its metrics.
Ctrl+clickorShift+clickto extend the selection. Server actions (Refresh, Restart, and so on) apply to every selected server.- The checkbox at the start of each row is independent of selection. The graph series for a server is drawn only while its checkbox is on.
See also
- Server metrics reference - what each column means
- Refreshing server data - how often the numbers update and how to force a refresh
- Server context menu - every right-click action
Was this page helpful?
Thanks for your feedback.