The main window
The main window is divided into four working areas. Once a few computers are loaded it looks like this:
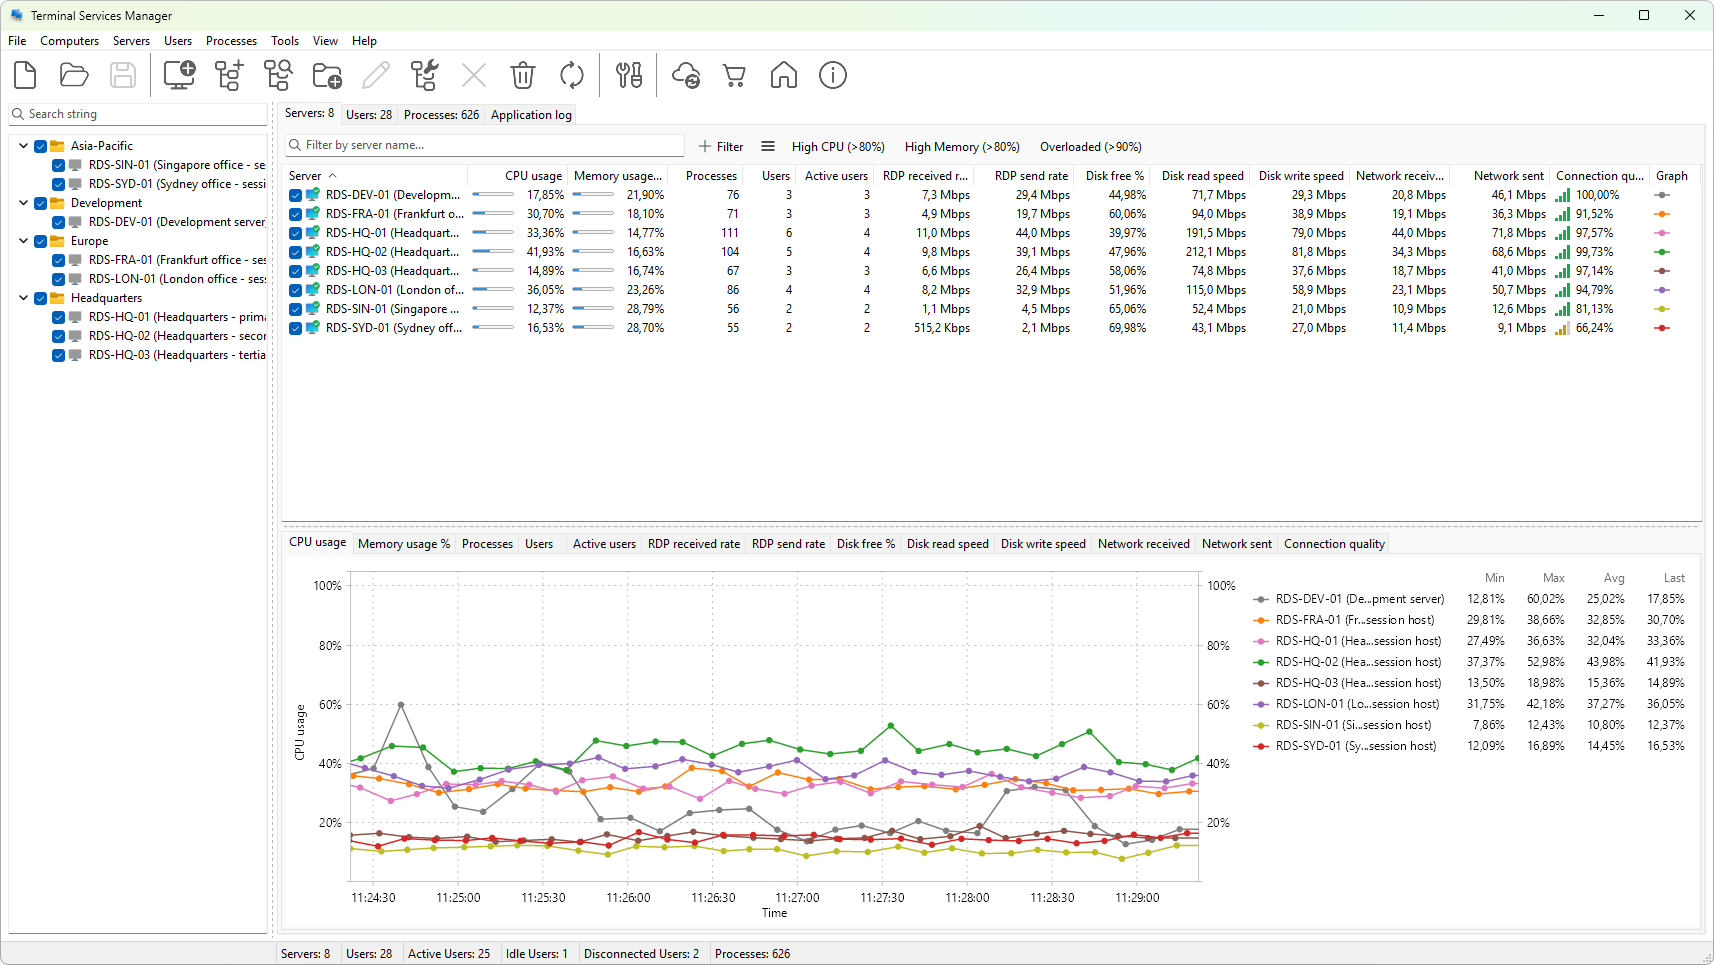
1. Menu and toolbar
The menu bar across the top groups every command. Items that act on a specific kind of object live in their own menu: Computers for the computer list, Servers, Users, Processes for the data tabs, and Tools for utilities such as custom command-line tools. The File, View, and Help menus carry application-wide commands.
The toolbar exposes the most frequently used actions as buttons. Hover over a button to see its name. Some buttons are enabled only when there is something to act on - for example, the Delete button is enabled only when a computer or group is selected in the computer list.
2. Computer list
The left panel holds the list of computers that the program will monitor. Computers can be grouped into folders; the group structure is purely organizational and does not affect monitoring. The checkbox next to each computer or group decides whether it is currently monitored - clearing the checkbox stops collection from that machine without removing it from the list.
The Search string field at the top of the panel filters the tree by name; only entries that match the search remain visible. To go back to the full tree, clear the field with its X button.
3. Information tabs
The right side of the window has four tabs:
- Servers lists every monitored server with its current CPU usage, memory usage, RDP bandwidth, disk and network activity, and counters for sessions, users, and processes.
- User sessions lists every active user session across all monitored servers, with idle time, logon time, client name, and per-session resource usage.
- Processes lists every process running in any of those sessions, with CPU, memory, handles, and threads.
- Application log shows the program's own runtime log - useful when investigating a connection problem to a server.
Each data tab has its own filter bar above the grid: a quick-search field, a Filter button that opens the filter builder, and quick preset buttons for common queries such as High CPU (>80%). Right-clicking a row opens the context menu with all the actions that apply to the selected item.
The header of each grid is your control over columns. Click a header to sort by that column, drag headers to reorder them, and right-click the header strip to show or hide individual columns.
4. Graph panel
Below each data grid is a graph panel. The tabs at the top of the panel choose which metric is drawn; you can have several graphs open at the same time (one per tab). Each graph plots the value over time for every checked row in the grid above. Right-click the chart for options such as pausing, switching the legend mode (current, average, minimum, maximum), changing the time window, copying the image to the clipboard, or exporting it as a PNG.
If you want a different set of metrics in the panel - or you want to hide a metric you do not use - right-click the tab strip at the top of the graph panel and choose Graph settings..., then tick only the ones you care about.
Status bar
The bar along the bottom of the window has seven panels, left to right:
- Status text - the leftmost panel. Shows progress messages for long-running operations such as a refresh or a wizard scan; otherwise blank. Its width tracks the computer list panel above it.
- Servers: N - count of monitored servers.
- Users: N - total user sessions across those servers.
- Active Users: N - sessions whose state is active.
- Idle Users: N - sessions whose state is idle.
- Disconnected Users: N - sessions whose state is disconnected.
- Processes: N - total processes across all monitored sessions.
The counter panels are fixed width; only the leftmost status-text panel resizes, tracking the computer list pane.
Resizing the layout
The vertical splitter between the computer list and the information panel, and the horizontal splitters between each data grid and its graph panel, can be dragged to give more room to whichever area you are working in. The layout is remembered between sessions.