Process metrics reference
The Processes tab has 15 data columns plus a graph column, grouped by category below. Use Configuring process columns to choose which ones you see.
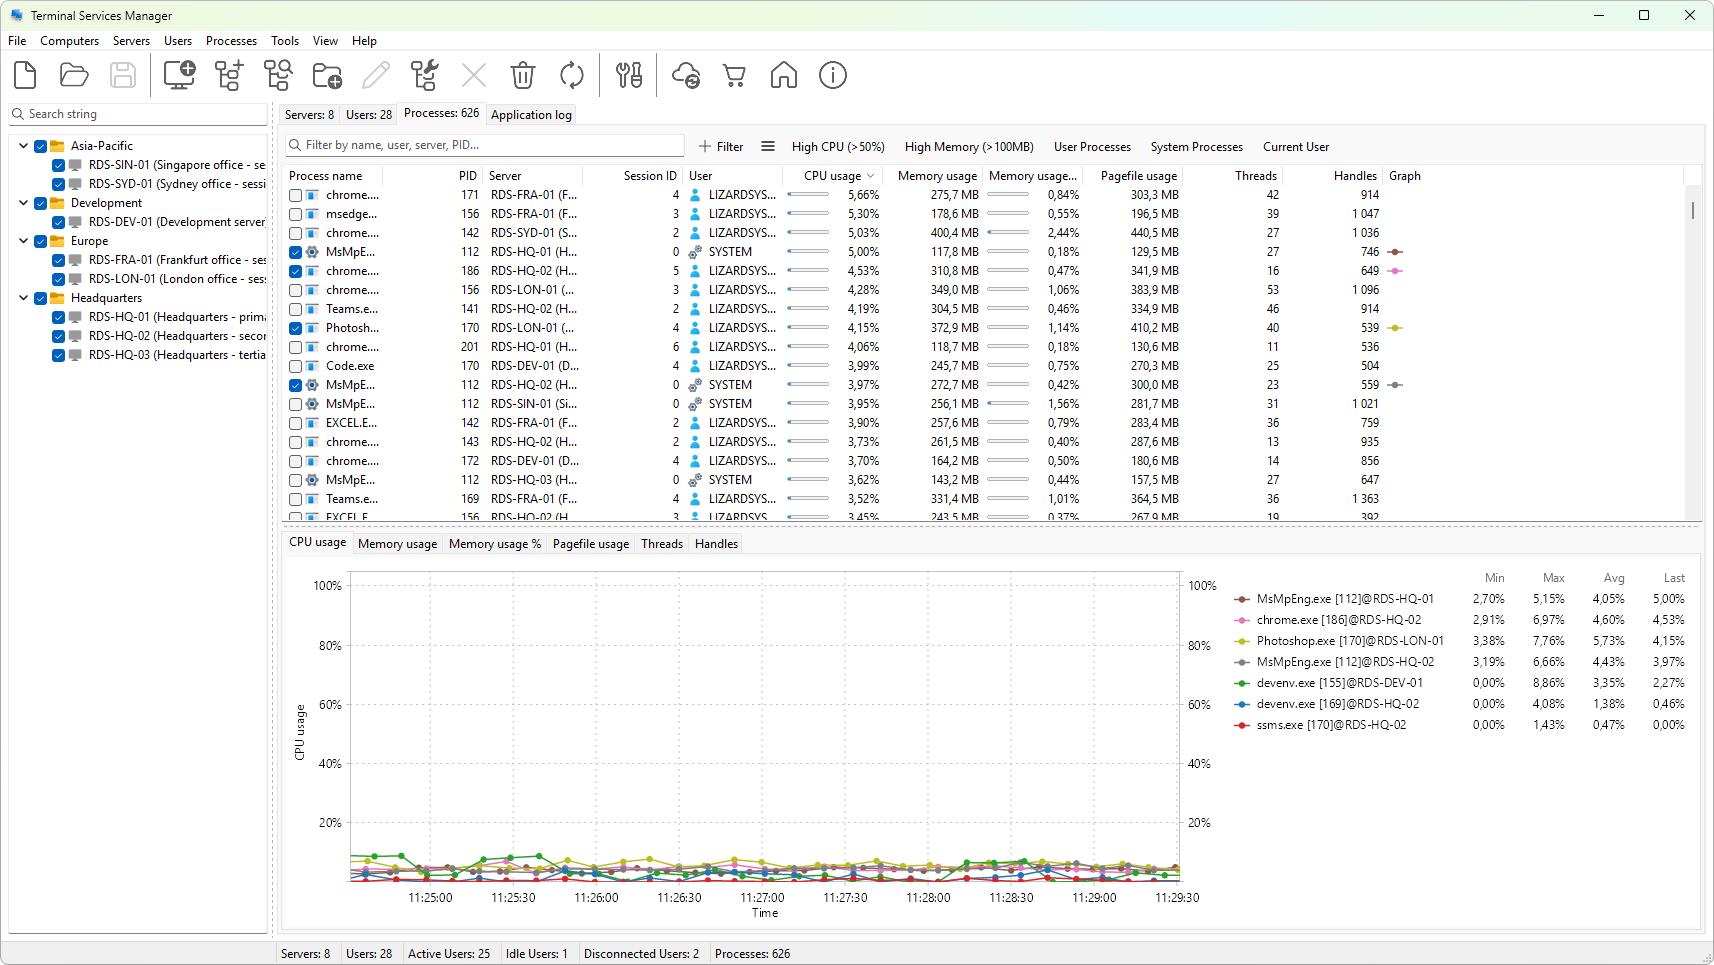
Metrics tagged (graphable) can also be plotted on a chart from the graph panel; see Process metric graphs reference for the full list and Choosing which metrics to graph for how to pick one.
Identity
- Process name - the executable's image name (for example,
notepad.exe). PID 0 is shown as System idle process. - PID - the numeric process ID assigned by the operating system on the host where the process runs. Unique per server, not across servers.
- Server - the server the process lives on.
- Session ID - the numeric user session the process belongs to.
- User - the account the process runs under (
DOMAIN\user). Blank when the owner cannot be resolved. - User SID - the security identifier of the user account, as a string.
CPU
- CPU usage (graphable) - percentage of total CPU time consumed by the process during the last refresh interval.
- CPU time - total CPU time consumed by the process since it started.
Memory
- Memory usage (graphable) - the working set: pages currently held in physical memory by the process. Formatted in KB, MB, or GB based on its size.
- Memory usage % (graphable) - working set as a percentage of installed RAM on the server.
- Peak memory usage - the largest working set the process has held since it started.
- Pagefile usage (graphable) - bytes the process has committed to the page file, formatted the same way as working set.
- Peak pagefile usage - the largest pagefile commit the process has held since it started.
Resources
- Threads (graphable) - number of threads the process currently has.
- Handles (graphable) - number of OS handles currently open by the process.
Graph column
- Graph - a sparkline of the metric you have chosen for this process. The available metrics are CPU usage, working set, memory usage %, pagefile usage, threads, and handles.
See also
- Process metric graphs reference - the 6 metrics that can be plotted on the process graph, with units and defaults.
Notes
- CPU usage and most other numbers come from PDH counters on the target server. Servers with Remote Registry disabled often report blank or zero values.
- The same process appears once per server. To see every instance of
chrome.exeacross your fleet, sort by Process name or use Filtering processes.
Was this page helpful?
Thanks for your feedback.