Graphs and charts
Each of the three data tabs (Servers, User sessions, Processes) has a graph panel below the tree. The panel plots one metric over time for every checked row in the tree above. Use it to see trends a single number cannot show: when CPU started climbing, how long a memory leak has been growing, when RDP latency spiked.
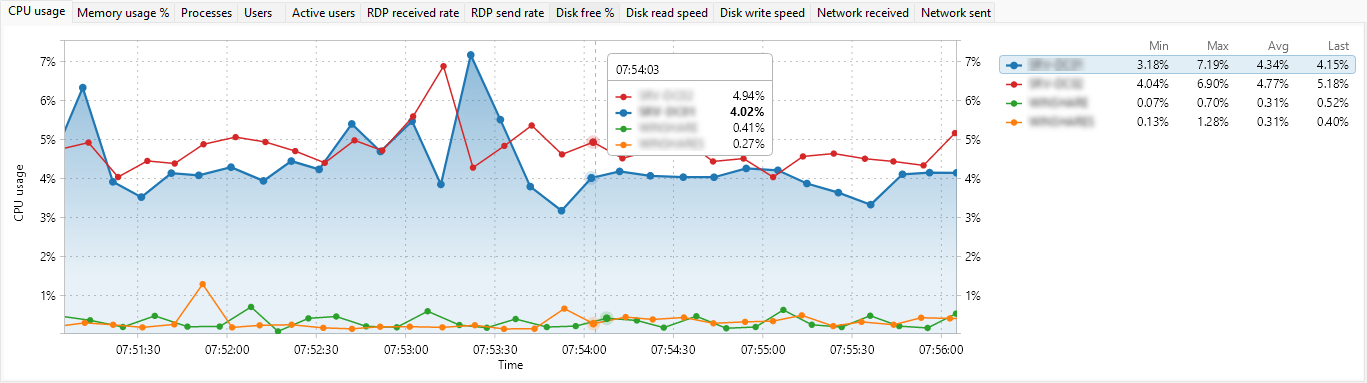
Each data tab keeps its own independent set of charts, with a tab strip of the metrics you have enabled. A row becomes a series when you tick its checkbox, so you decide exactly which servers, sessions, or processes are compared side by side. The time axis scrolls left as new samples arrive, and the value axis scales to the metric (percent, bytes per second, megabytes, or a plain count).
This section explains which metrics each entity type can plot, how to choose which ones appear as tabs, and how to drive the chart with the context menu - pause, time range, auto-scale, grid, legend, and tooltips. It finishes with the reference tables for server, user session, and process metrics, and with copying or exporting a chart as an image.