The Processes tab
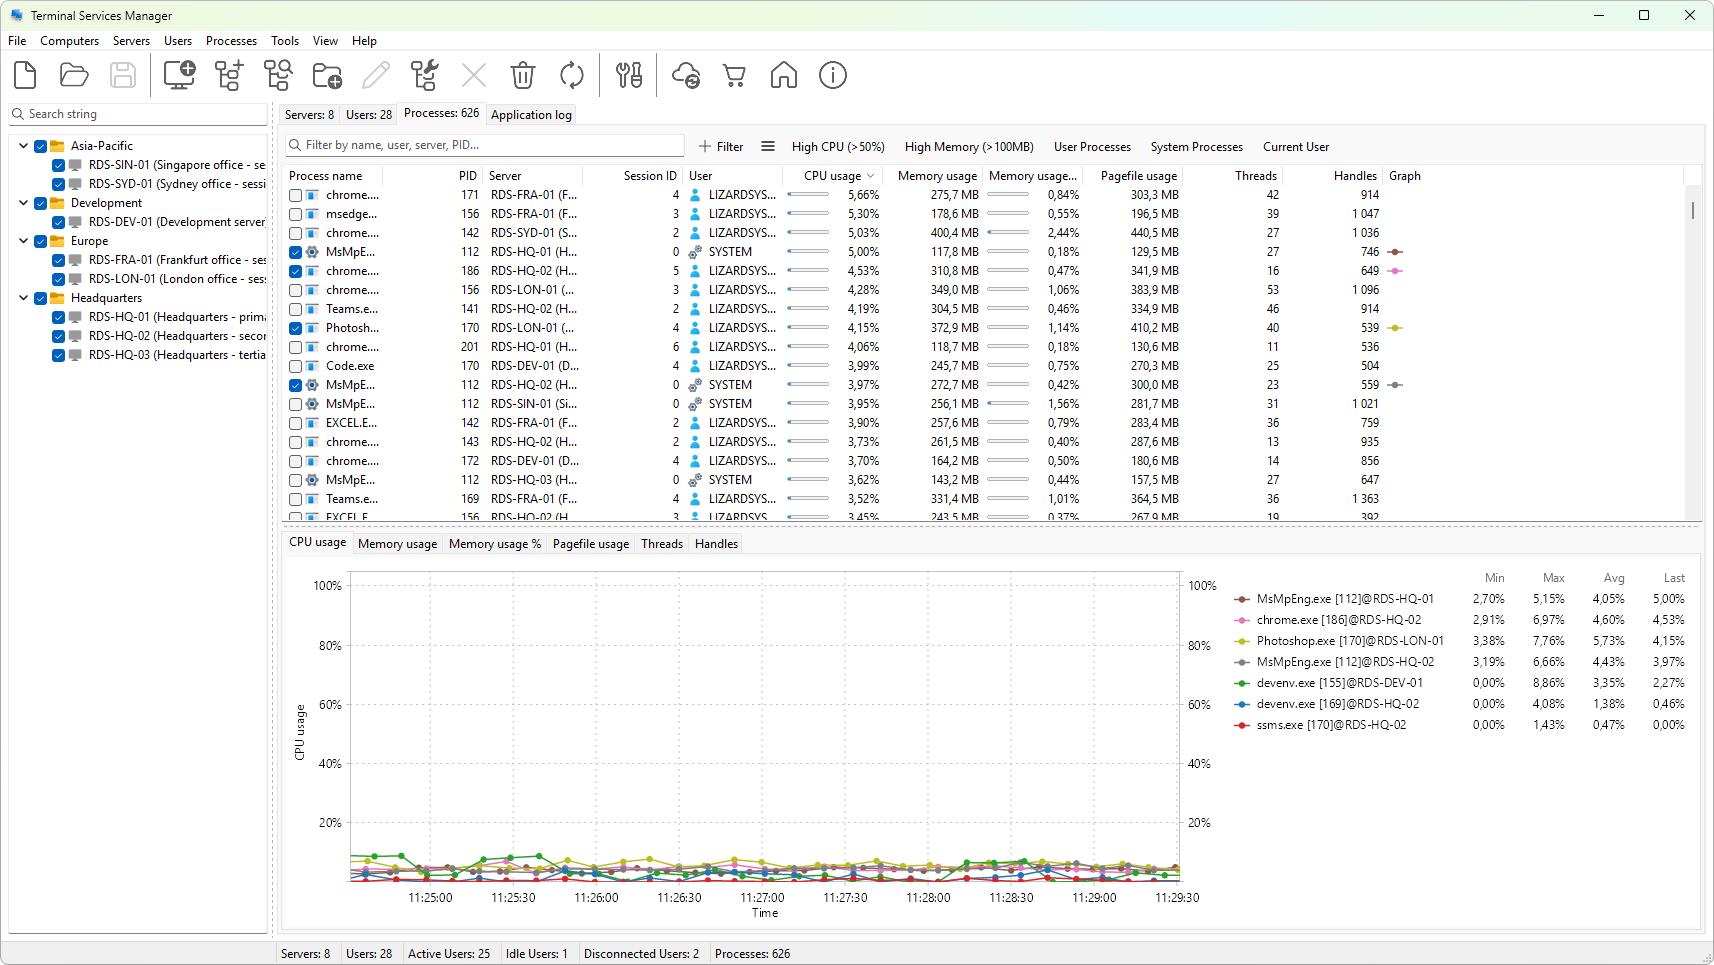
The Processes tab is on the right-hand pane of the main window. Each row is one process running on one server in one session. Across the 15 data columns plus the graph column you can see identity (name, PID, owner), CPU and memory usage, threads, and handles.
Layout
- Row - one process. Processes are not aggregated by name; if
notepad.exeruns in three sessions you see three rows. - Header - click to sort, right-click for the column-header menu.
- Filter panel - the strip above the tree holds a quick search, a filter chip area, and a presets menu. See Filtering processes.
- Splitter - separates the process tree from the graph panel below it. Drag to resize.
Selection
- Click to select. The graph panel below redraws for the selected process.
Ctrl+clickorShift+clickextends the selection. Actions apply to every selected process.
See also
Was this page helpful?
Thanks for your feedback.