Server metrics reference
The Servers tab has 29 columns. They are grouped by category below. Use Configuring server columns to hide the ones you do not need and reorder the rest.
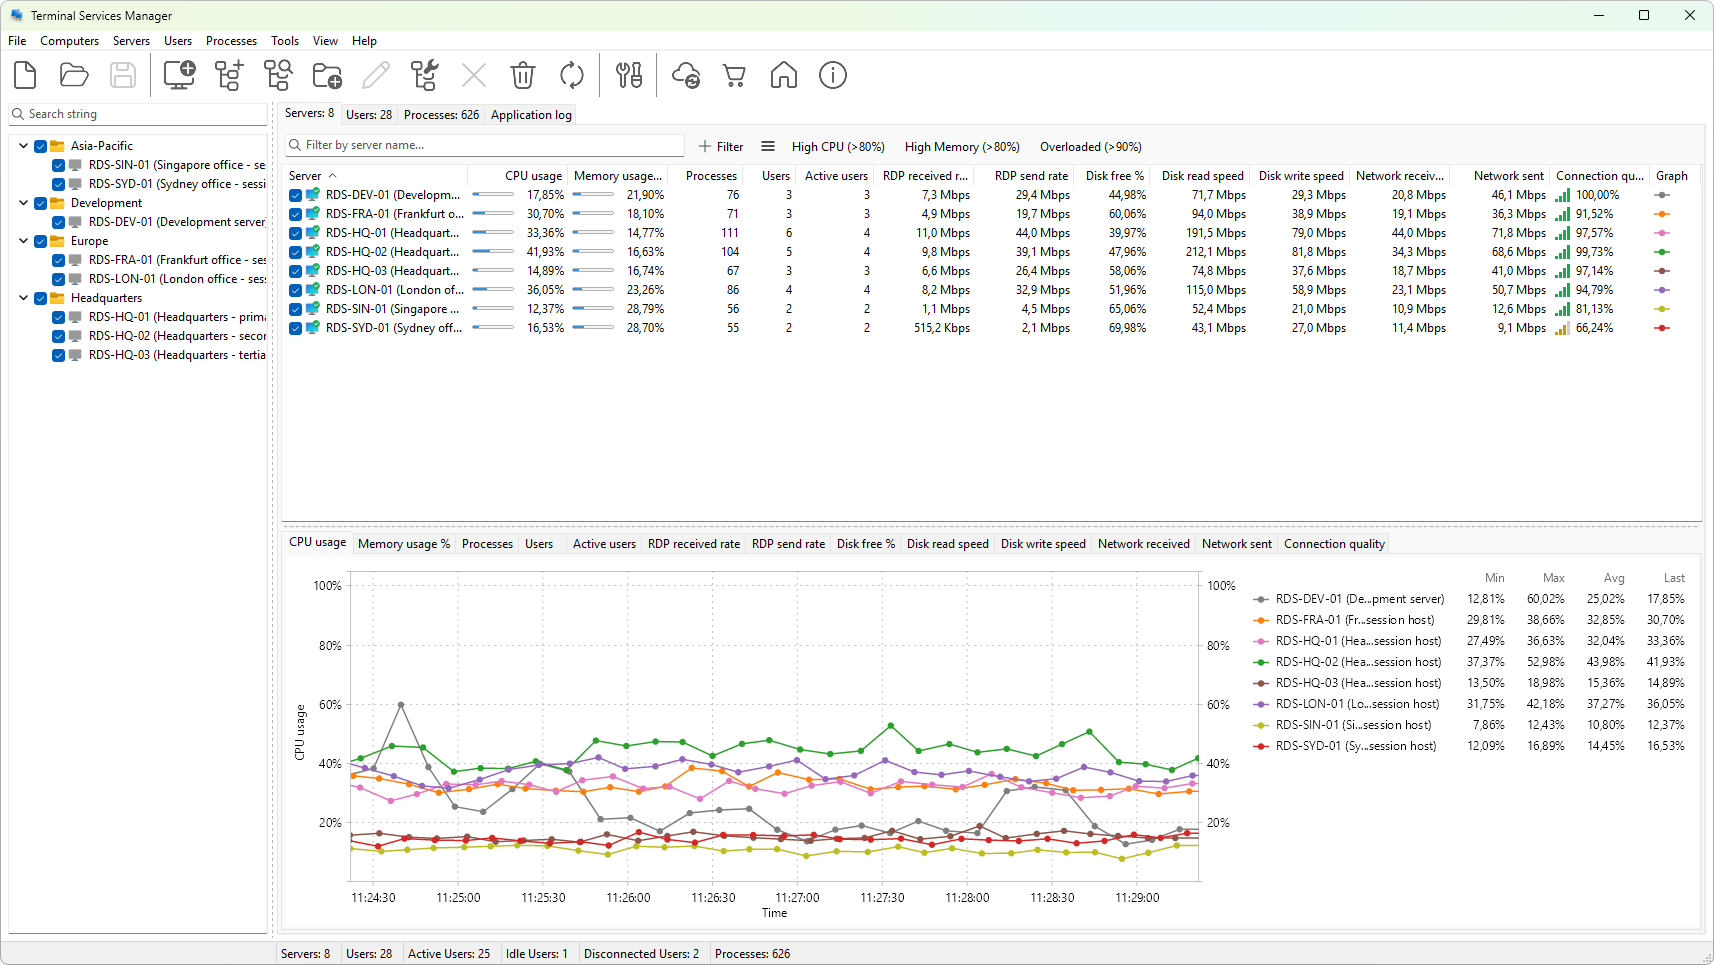
Metrics tagged (graphable) can also be plotted on a chart from the graph panel; see Server metric graphs reference for the full list and Choosing which metrics to graph for how to pick one.
Identity
- Server - the server name as it appears in the computer list, followed by the description if one is set. The icon on the left shows whether the last refresh succeeded.
CPU and memory
- CPU usage (graphable) - the percentage of CPU time consumed across all cores during the last refresh interval.
- Memory usage (graphable) - physical memory currently in use. The number is formatted in KB, MB, or GB based on its size and your preferences.
- Memory usage % (graphable) - memory usage as a percentage of installed RAM.
- Available memory (graphable) - physical memory not currently in use, formatted the same way as memory usage.
- Pagefile usage % (graphable) - percentage of the page file currently committed.
Sessions and users
- Processes (graphable) - total number of processes running on the server across every session.
- Sessions (graphable) - total number of sessions on the server, including the console.
- Users (graphable) - total number of users logged on, regardless of state.
- Active users (graphable) - users whose session is currently active.
- Idle users (graphable) - users whose session is active but who have been idle for longer than the idle threshold set in Preferences.
- Disconnected users (graphable) - users whose session is disconnected but still on the server.
RDP traffic
- RDP received rate (graphable) - traffic rate flowing from clients into the server across all RDP connections. The number is formatted as bytes/s or bits/s based on your speed-unit preference.
- RDP send rate (graphable) - traffic rate flowing from the server out to clients, formatted the same way.
RDP connection quality
These metrics are averaged across the server's active RDP sessions and reflect what users actually experience.
- Avg TCP RTT (graphable) - average round-trip latency between client and server, in milliseconds.
- Avg output FPS (graphable) - average number of screen-update frames the server sends per second.
- Avg input FPS (graphable) - average number of input frames the server receives per second.
- Avg frame quality (graphable) - average frame quality as a percentage. Lower values mean more aggressive compression, usually a sign of constrained bandwidth.
- Connection quality (graphable) - median connection-quality score across active sessions, combining latency, packet loss, and bandwidth.
Disk
- Disk free % (graphable) - free space on the system drive, as a percentage of the drive's capacity.
- Disk free (graphable) - free space on the system drive, formatted in KB, MB, or GB based on its size.
- Disk read speed (graphable) - read throughput on the system drive, formatted in bytes/s or bits/s.
- Disk write speed (graphable) - write throughput on the system drive, formatted the same way.
- Disk busy % (graphable) - the percentage of time the system drive was busy servicing requests during the last refresh interval.
- Disk queue length (graphable) - the average number of read or write requests waiting in the system drive's queue.
Network
- Network received (graphable) - inbound traffic rate across all network interfaces.
- Network sent (graphable) - outbound traffic rate across all network interfaces.
Uptime
- System uptime - how long the server has been running since its last restart.
Graph column
- Graph - a small sparkline for one metric per server. Use the graph panel and the column menu to choose which metric to plot; see Choosing which metrics to graph.
See also
- Server metric graphs reference - the 26 metrics that can be plotted on the server graph, with units and defaults.
Notes
- Numbers come from a mix of the Windows Terminal Services API, WMI (
Win32_OperatingSystemand related classes), and the Performance Data Helper (PDH) library. The first refresh after a server is added often takes several seconds because PDH counters have to warm up; subsequent refreshes are fast. - A blank cell means the metric could not be read this time, or the value was zero. The most common reasons for blank PDH-based columns are the Remote Registry service being stopped on the target, or the current credentials lacking the required permission.
Was this page helpful?
Thanks for your feedback.