Copying and exporting graphs
You can grab a snapshot of the current chart as an image, either onto the clipboard for pasting into a message or as a file for an attachment or report.
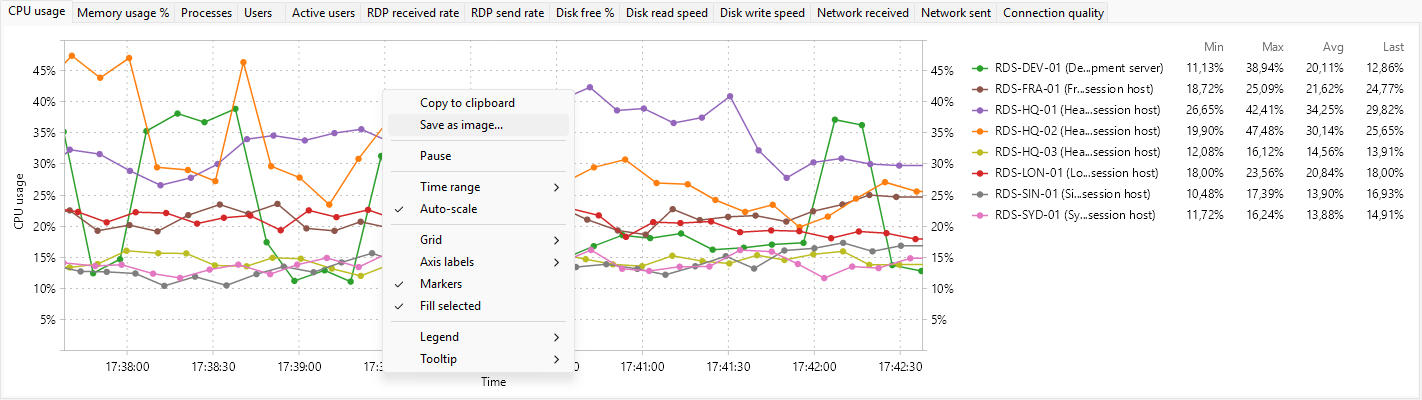
Copy to clipboard
Right-click the chart and choose Copy to clipboard. The image of the chart as currently rendered (including the legend, grid, and axis labels) is placed on the clipboard as a bitmap. Paste with Ctrl+V into anything that accepts pasted images (a chat client, an email, a document, a screenshot tool).
Save as image
Right-click the chart and choose Save as image.... A save-file dialog opens with a default name based on the metric.
The dialog writes a single PNG image; that's the only format the exporter supports. The exported image matches what's on screen: the same metric, the same time range, the same series, the same axis settings.
If you need JPEG or another format, open the PNG in any image editor or use Copy to clipboard and paste into a tool that lets you save in the format you need.
What is captured
A chart export is a snapshot at the moment you press the action. It is not a live or animated image; it does not include history beyond the visible time range. For a recurring snapshot (every hour, every day), script the program with the same export action.
To capture the entire panel (the strip of metric tabs plus the chart), use a screenshot tool; the Save as image... action only captures the active tab's chart.