Monitoring servers
The Servers tab watches every Remote Desktop Services host in your computer list at once. Each row is one server, and the 29 columns show live CPU, memory, disk, network, RDP traffic, session counts, and connection-quality numbers. It is the place to start when you want a single view of how all your hosts are doing right now.
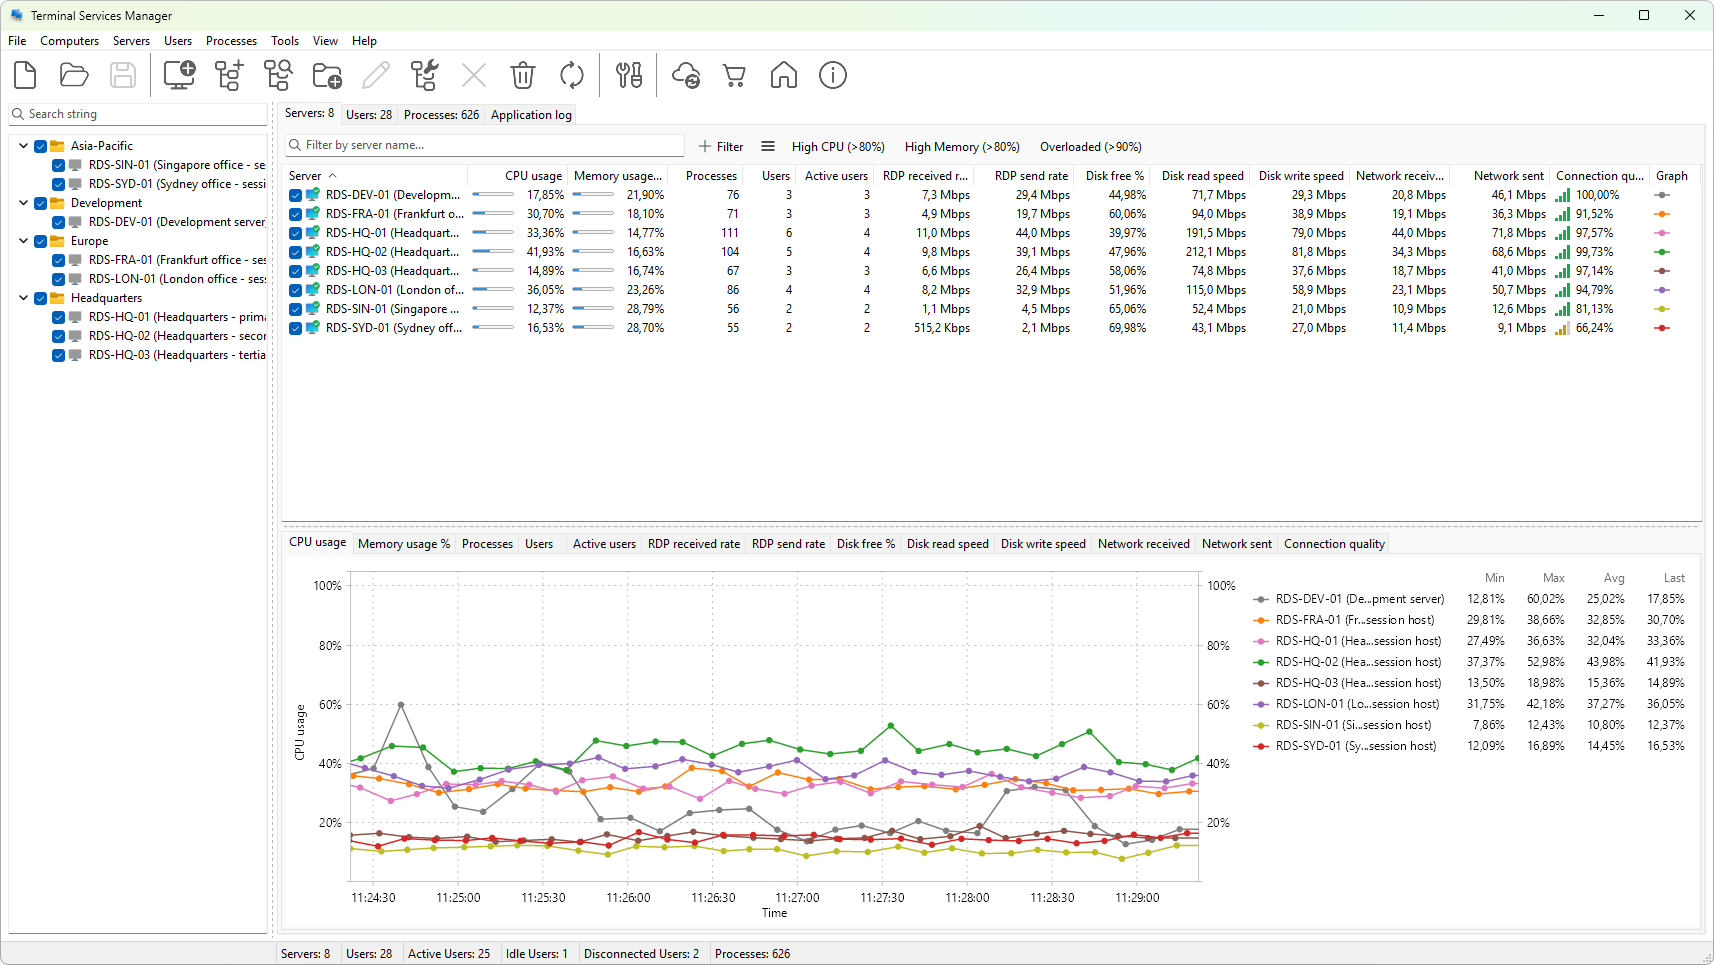
From the tab you can refresh the data on demand or on a timer, choose which columns to show, sort and group the list, and export what you see to the clipboard or a CSV file. The right-click context menu adds per-server actions such as connecting with Remote Desktop, opening management consoles, and shutting a server down.
Use this section when you are setting up monitoring for the first time, when you want to know what a particular column means, or when you need to get the current numbers out of the program and into a report.