User session metric graphs reference
The User sessions tab graph panel can plot any of these 21 metrics. See User session metrics reference for what each one measures. The matching panels for the other tabs are covered in the server metric graphs reference and the process metric graphs reference.
Performance
| Metric | Unit | Default |
|---|---|---|
| CPU usage | % | shown |
| Memory usage | MB | shown |
| Memory usage % | % | shown |
| Processes | count | shown |
| Handles | count | shown |
| Threads | count | shown |
RDP traffic
| Metric | Unit | Default |
|---|---|---|
| RDP received rate | B/s | shown |
| RDP send rate | B/s | shown |
| TCP bandwidth | B/s | shown |
RDP quality
| Metric | Unit | Default |
|---|---|---|
| TCP RTT | ms | shown |
| Output FPS | fps | shown |
| Input FPS | fps | hidden |
| Frame quality | % | hidden |
| Loss rate | % | shown |
| Retransmission rate | % | hidden |
| FEC rate | % | hidden |
| Frames skipped (client) | count | hidden |
| Frames skipped (network) | count | hidden |
| Frames skipped (server) | count | hidden |
| Encoding time | ms | hidden |
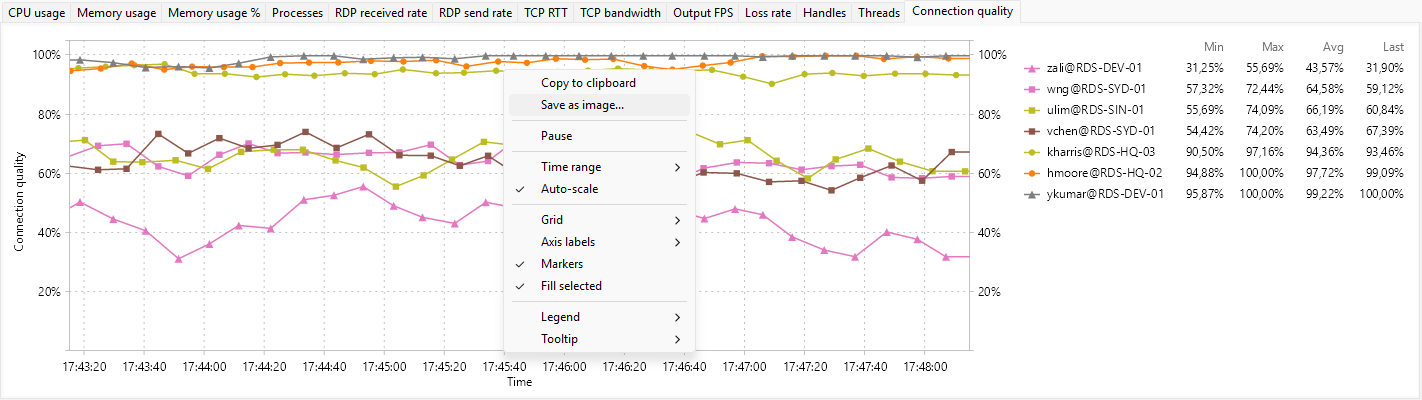
| Connection quality | % | shown |
Was this page helpful?
Thanks for your feedback.