Filter fields reference
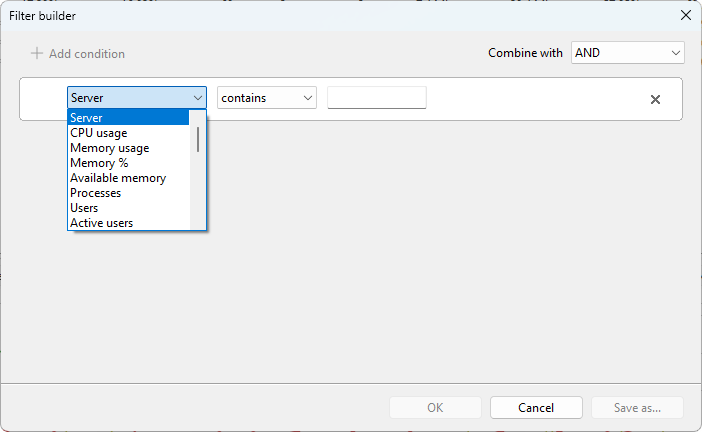
Each tab has its own set of fields available in the filter builder. The fields below are grouped by category. The unit shown is the default; for numeric fields you can switch to a different unit in the builder's value edit.
Server fields
Available on the Servers tab.
Identity
- Server (text) - server name as it appears in the computer list.
Performance
- CPU usage (%) - server-wide CPU.
- Memory usage (MB) - committed memory.
- Memory % (%) - committed memory as a fraction of installed RAM.
- Available memory (MB) - physical memory not in use.
- Pagefile usage % (%) - page file commit fraction.
- System uptime (sec) - how long since the server booted.
Sessions and users
- Processes - process count across all sessions.
- Users - logged-on user count.
- Active users - currently active.
- Idle users - active but idle longer than the threshold.
- Disconnected users - session present but client disconnected.
RDP traffic
- RDP received rate (B/s) - aggregate inbound RDP bytes per second.
- RDP send rate (B/s) - aggregate outbound.
Disk
- Disk free % (%) - free space on the system drive.
- Disk free (MB) - same as megabytes.
- Disk read speed (B/s) - bytes per second read.
- Disk write speed (B/s) - bytes per second written.
- Disk busy % (%) - time the disk was busy servicing requests.
- Disk queue length - queued I/O requests.
Network
- Network received (B/s) - inbound across all interfaces.
- Network sent (B/s) - outbound across all interfaces.
RDP connection quality (aggregated across sessions)
- Avg TCP RTT (ms) - round-trip latency, averaged.
- Avg output FPS (fps) - server-to-client frame rate.
- Avg input FPS (fps) - client-to-server frame rate.
- Avg frame quality (%) - average frame quality.
- Connection quality (%) - median connection quality across active sessions.
User session fields
Available on the User sessions tab.
Identity
- User name (text)
- Domain (text) - domain or computer that authenticated the account.
- Server (text) - host the session is on.
- Host (text) - RDS session host.
- Farm (text) - RDS deployment.
- Session ID - numeric session ID.
- Session (text) - WinStation name.
- State (text) - active, disconnected, idle, etc.
Performance
- CPU usage (%) - session-wide CPU.
- Memory usage (MB) - working set across the session's processes.
- Memory % (%) - as a fraction of installed RAM.
- Processes - count.
- Handles - OS handles open across the session.
- Threads - threads in the session's processes.
Session timing
- Idle time (sec) - time since last user input.
- Session duration (sec) - since logon.
- Connected time (sec) - since most recent connect.
Client
- Client name (text) - hostname the client reports.
- Client address (text) - client IP.
RDP traffic
- RDP received rate (B/s)
- RDP send rate (B/s)
RDP connection quality
- RTT (ms) - round-trip latency.
- Output FPS - server-to-client frame rate.
- Input FPS - client-to-server frame rate.
- Connection quality (%) - overall grade.
- Loss rate (%) - packet loss.
- Retransmission rate (%) - retransmitted packets.
- FEC rate (%) - forward-error-correction overhead.
- Frames skipped (client) - frames the client could not render in time.
- Frames skipped (network) - frames dropped on the wire.
- Frames skipped (server) - frames the server skipped before sending.
- Encoding time (ms) - server-side encode time per frame batch.
Process fields
Available on the Processes tab.
Identity
- Process name (text) - executable image name.
- Process ID - PID.
- Server (text) - host the process runs on.
- Session ID - session the process belongs to.
- User name (text)
- User SID (text)
CPU and memory
- CPU usage (%)
- CPU time (sec) - total CPU consumed since the process started.
- Working set (MB) - resident memory.
- Memory % (%) - working set as a fraction of installed RAM.
- Peak working set (MB) - largest working set held since start.
- Pagefile usage (MB) - committed pagefile.
- Peak pagefile (MB) - largest committed pagefile since start.
Resources
- Threads - thread count.
- Handles - OS handles open.
Notes
- Numeric values are entered in the unit you pick in the builder; internally the filter compares in a normalized unit (KB for sizes, B/s for speeds, seconds for time), so picking GB vs MB does not change the result.
- A field that the server cannot read this refresh (for example, Memory % when Remote Registry is stopped) is treated as zero by the filter engine. Conditions that depend on such a field may include or exclude that row unexpectedly until the next successful refresh.
Was this page helpful?
Thanks for your feedback.