Choosing which metrics to graph
Of the metrics the program can plot, only some show up as tabs on the panel out of the box. You choose which appear from the metric tab strip below the chart.
The metric tab menu
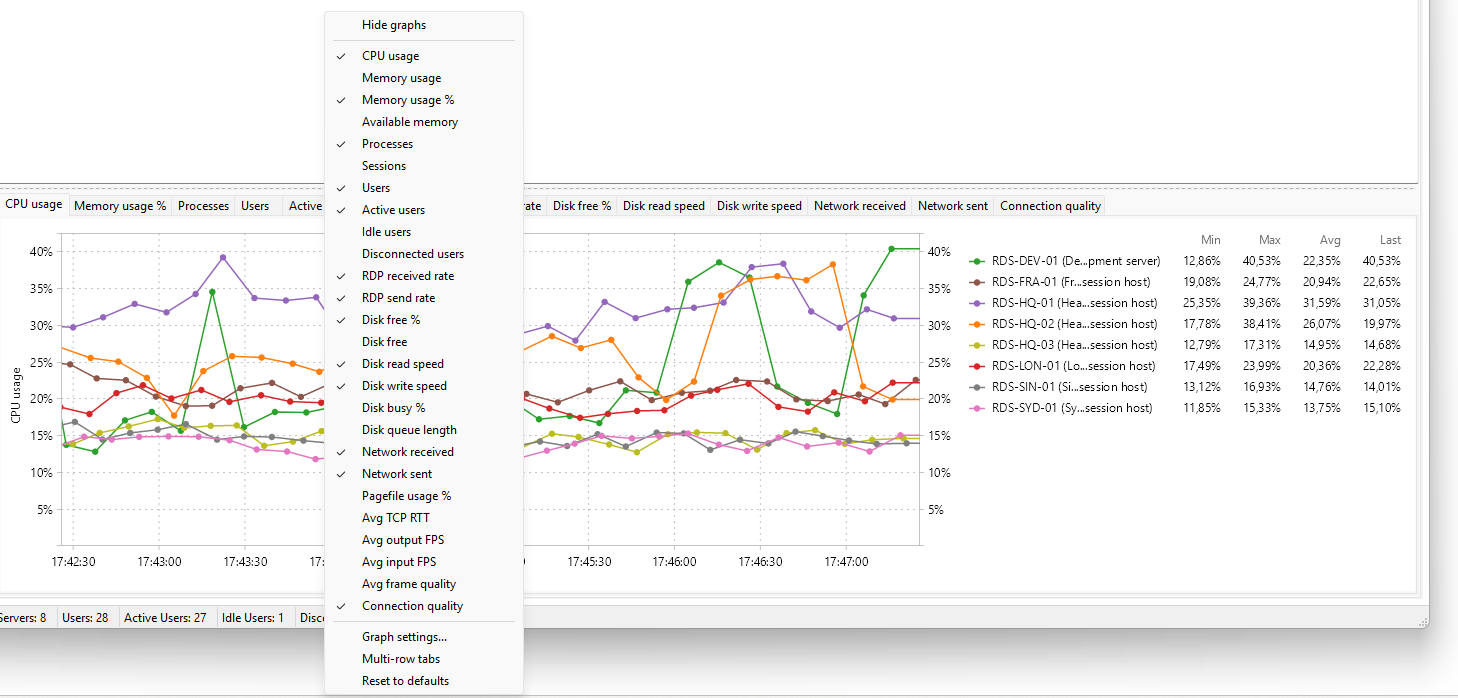
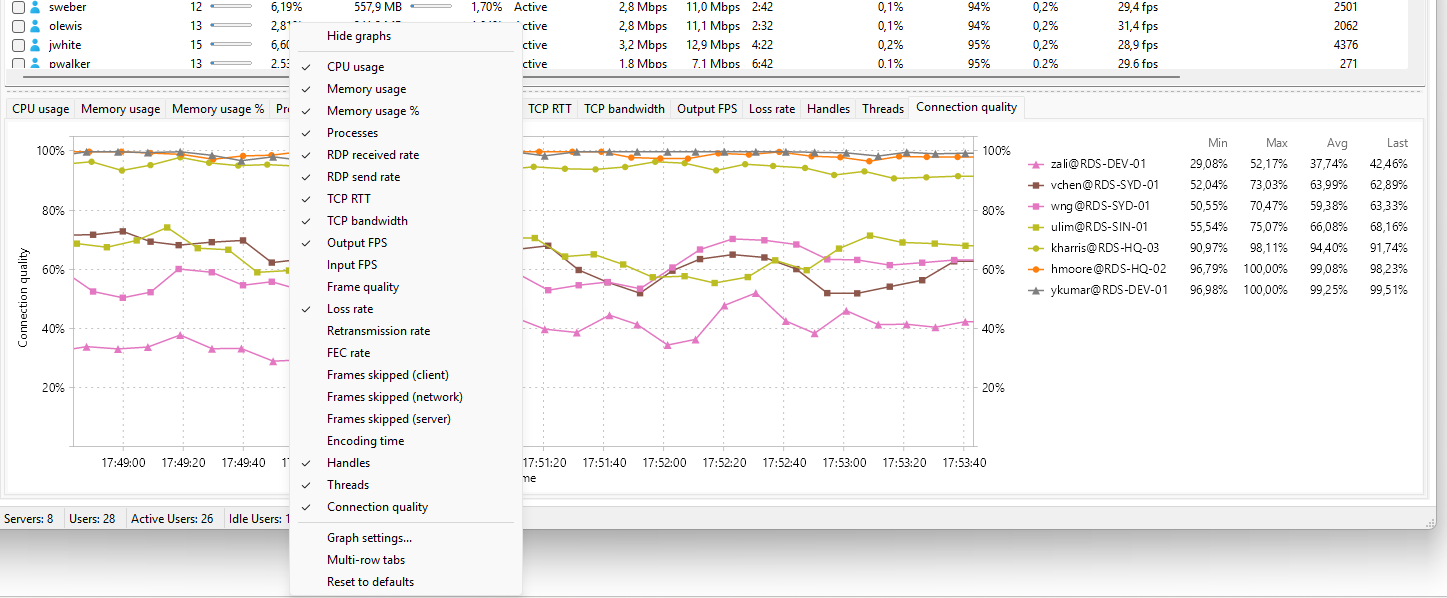
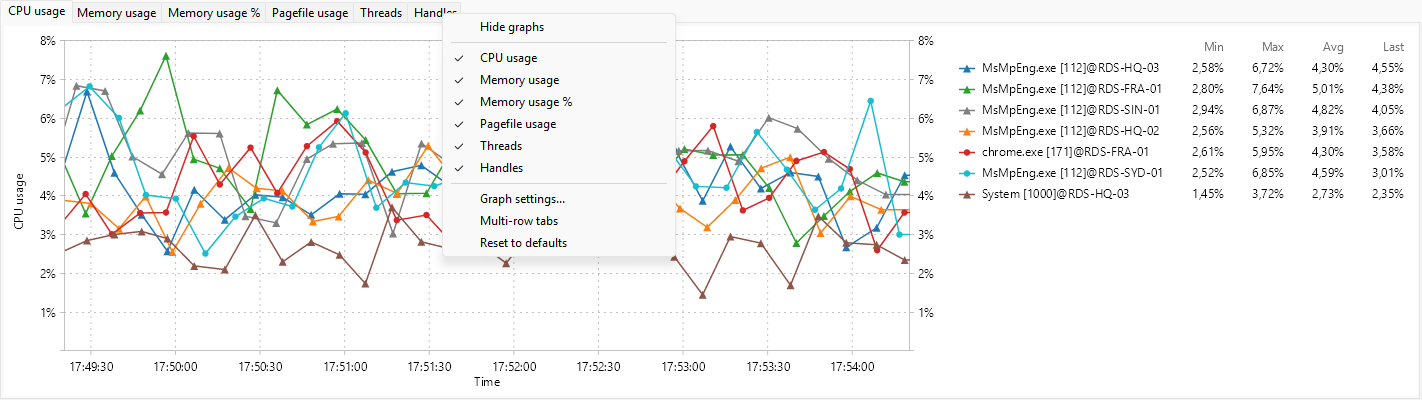
Right-click the metric tab strip (the row of metric names below the chart) on the tab whose metrics you want to edit (Servers, User sessions, or Processes). The menu lists every metric the program collects for that entity type, each with a checkbox - tick or untick a metric to show or hide its tab directly.
The list differs by tab - Servers, User sessions, and Processes each expose their own metrics:
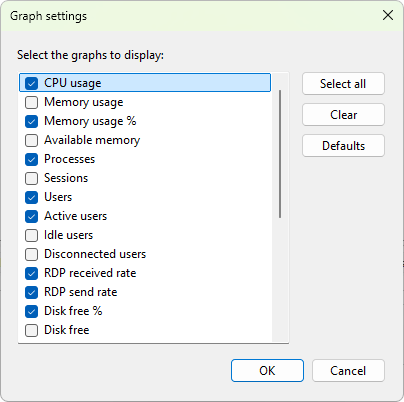
For the same choices in a dialog (with Select all, Clear, and Defaults buttons), choose Graph settings... from that menu, or Servers / Users / Processes > Graphs > Graph settings... on the main menu while the matching tab is active.
What the checkbox does
A ticked metric becomes a tab in the panel for that data tab. An unticked metric is hidden; ticking it later restores the tab. The metrics themselves are always collected; the dialog only controls visibility.
Buttons
- Select all - tick every metric.
- Clear - untick every metric.
- Defaults - reset to the shipped defaults for this entity type.
- OK - save the selection and rebuild the metric strip.
- Cancel - keep the layout that was in place when you opened the dialog.
Defaults that ship
- Servers: CPU usage, Memory usage %, Processes, Users, Active users, RDP received rate, RDP send rate, Disk free %, Disk read speed, Disk write speed, Network received, Network sent, Connection quality.
- User sessions: CPU usage, Memory usage, Memory usage %, Processes, RDP received rate, RDP send rate, TCP RTT, TCP bandwidth, Output FPS, Loss rate, Handles, Threads, Connection quality.
- Processes: every available metric (CPU usage, Memory usage, Memory usage %, Pagefile usage, Threads, Handles).
The defaults are tuned for "the numbers most people watch first". Add the niche ones (frames skipped, FEC rate, encoding time) when you need to dig into RDP quality. To change the defaults that every newly opened chart starts with, see graph options in Preferences.