Graph options
The Graphs page sets the defaults that every newly opened graph uses. Changes here do not affect open charts; each chart has its own toggles in its context menu (see Graph controls).
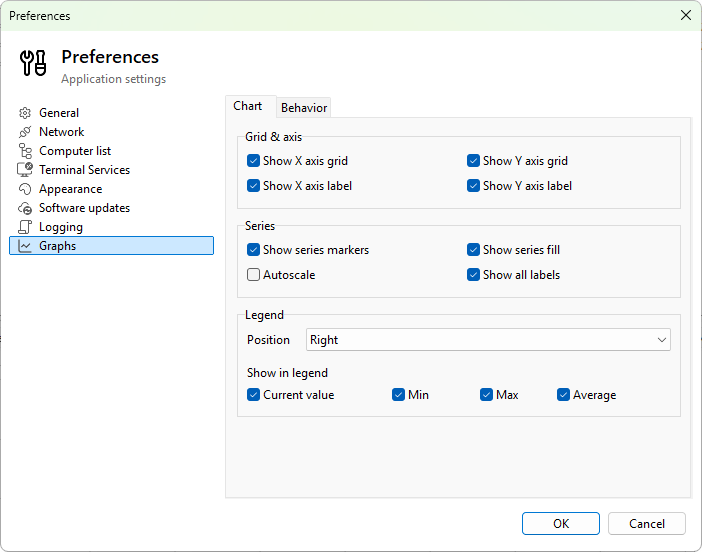
Chart tab
Grid & axis
- Show X axis grid - vertical grid lines at time-axis ticks.
- Show Y axis grid - horizontal grid lines at value-axis ticks.
- Show X axis label - print "Time" beneath the time axis.
- Show Y axis label - print the unit next to the value axis.
Series
- Show series markers - draw a small dot at every sample.
- Show series fill - shade the area between the line and the baseline.
- Autoscale - let the value axis adjust to the data.
- Show all labels - print the value at each visible sample on top of the chart. Useful for short, sparsely-sampled series; visually noisy for dense ones.
Legend
- Position - where the legend appears: None, Right (default), Left, Top, Bottom.
- Current value - the most recent value in the legend.
- Min - the minimum over the visible range.
- Max - the maximum.
- Average - the arithmetic mean.
Behavior tab
- Time window - the visible time range a new chart opens with. Options: 1, 2, 5 (default), 10, 15, 30, 45, and 60 minutes.
- Refresh speed - how often the chart redraws. A multiplier on an adaptive base interval:
- Fast - smoothest scrolling, highest CPU usage.
- Normal (default) - balanced.
- Slow - reduced CPU.
- Very slow - minimal CPU, chart scrolls in larger steps.
- Data update only - no continuous redraw; the chart updates only when new samples arrive. The lowest CPU and battery usage.
- Tooltip mode - what hovering shows: None, All series (default), or Nearest point (only the series the cursor is closest to).
Apply scope
These are defaults for new graphs. To change an existing chart, use its context menu; the per-chart settings override the defaults.
Was this page helpful?
Thanks for your feedback.