
On a Remote Desktop Services host, a handful of busy sessions can slow everyone down. Terminal server monitoring is how you catch that early: watch who is connected, how many sessions are active or sitting disconnected, and which users and processes are eating CPU and memory before the complaints start.
Windows ships with several tools that show this, each covering part of the picture. This guide walks through the built-in options, then shows how Terminal Services Manager pulls the same data from every server into one view.
What to watch on an RDS host
A useful monitoring routine covers five things:
- Active, idle, and disconnected sessions on each host, and how long each has been in that state.
- Who is logged on, from which client, and since when.
- Per-user CPU and memory, so one heavy session does not starve the rest.
- Processes inside each session, to find the app that is actually to blame.
- Logon and disconnect events, for a record of when users came and went.
Built-in ways to monitor terminal server sessions
Command line: quser and qwinsta
quser (query user) lists the sessions on a host with their state, idle time, and logon time:
quser /server:RDSH01
qwinsta (also available as query session) adds the session type and client device:
qwinsta /server:RDSH01
Both accept /server: so you can check a remote host without signing in to it. They are quick for a single server, but you run them one host at a time and read plain text, with no sorting or resource figures.
Task Manager
On the session host, the Users tab in Task Manager lists every connected user with their CPU, memory, disk, and network use. Expand a user to see the processes inside that session, and end a runaway one from the same place. It is the fastest way to see live resource use, but only for the machine you are signed in to.
Server Manager
For a full RDS deployment, Server Manager > Remote Desktop Services > Collections shows the connections in each collection, with the user, session state, and host. It reflects the deployment through the Connection Broker, so it is handy for a farm, though it does not break down CPU or memory per user. Session management moved here after Microsoft removed the tsadmin.msc snap-in: see where Terminal Services Manager went in Windows Server 2012 and later.
Performance Monitor counters
Performance Monitor (perfmon) exposes session counts as counters you can chart or log. The Terminal Services object carries Active Sessions, Inactive Sessions, and Total Sessions for the host, and the Terminal Services Session object holds per-session counters such as processor and memory use. These are what you point a long-term baseline or an alert at. (If the counters read zero or throw a "property value conflict", see how to fix empty CPU and memory counters.)
Event Viewer: session logon and disconnect events
For a history of session activity, two operational logs record every state change:
Applications and Services Logs > Microsoft > Windows > TerminalServices-LocalSessionManager > Operational
| Event ID | Meaning |
|---|---|
| 21 | Session logon succeeded |
| 22 | Shell (desktop) start notification |
| 23 | Session logoff succeeded |
| 24 | Session has been disconnected |
| 25 | Session reconnection succeeded |
TerminalServices-RemoteConnectionManager > Operational logs event 1149 when network-level authentication succeeds, including the source user and client address, which is useful for tracking where connections come from.
These logs answer "when did this user connect and drop" after the fact, but they are per-server and awkward to correlate across a farm. Reconstructing whole sessions means pairing each logon with its logoff across both logs. How to audit RDP logon history walks through that.
Where the built-in tools run out
Each tool above works well on one host. Across a farm the gaps show:
- No single screen for every server at once.
- No way to sort all users by CPU or memory to find the worst offender fast.
- Session actions and process views live in separate tools.
For a few servers you can live with it. For a real deployment, switching between consoles per host is where the time goes.
Monitor every RDS server from one console
Terminal Services Manager collects sessions, users, and processes from all your Remote Desktop servers into a single window, and refreshes them live.
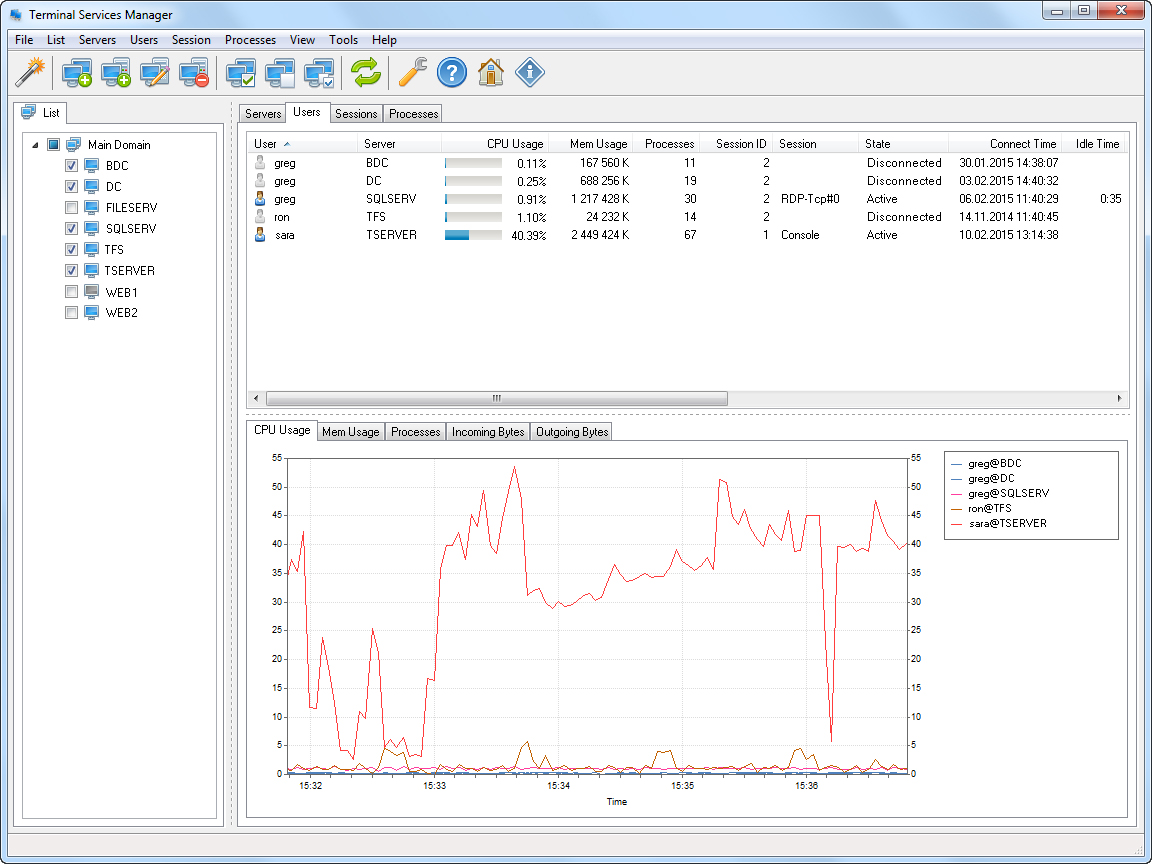
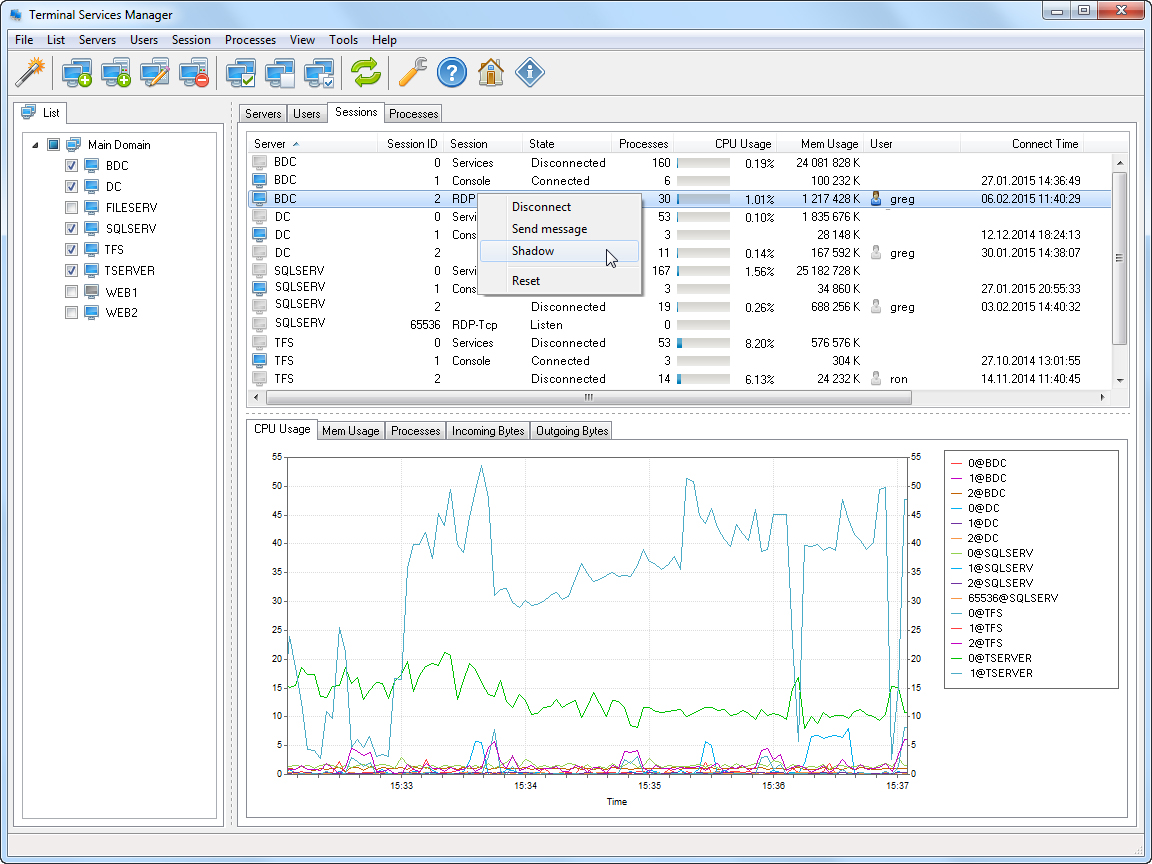
See every session in one place. The User sessions tab lists active, idle, and disconnected sessions across all servers, with the user, client, state, and idle time. Sort by any column, or apply a preset such as Disconnected Users to narrow the list.
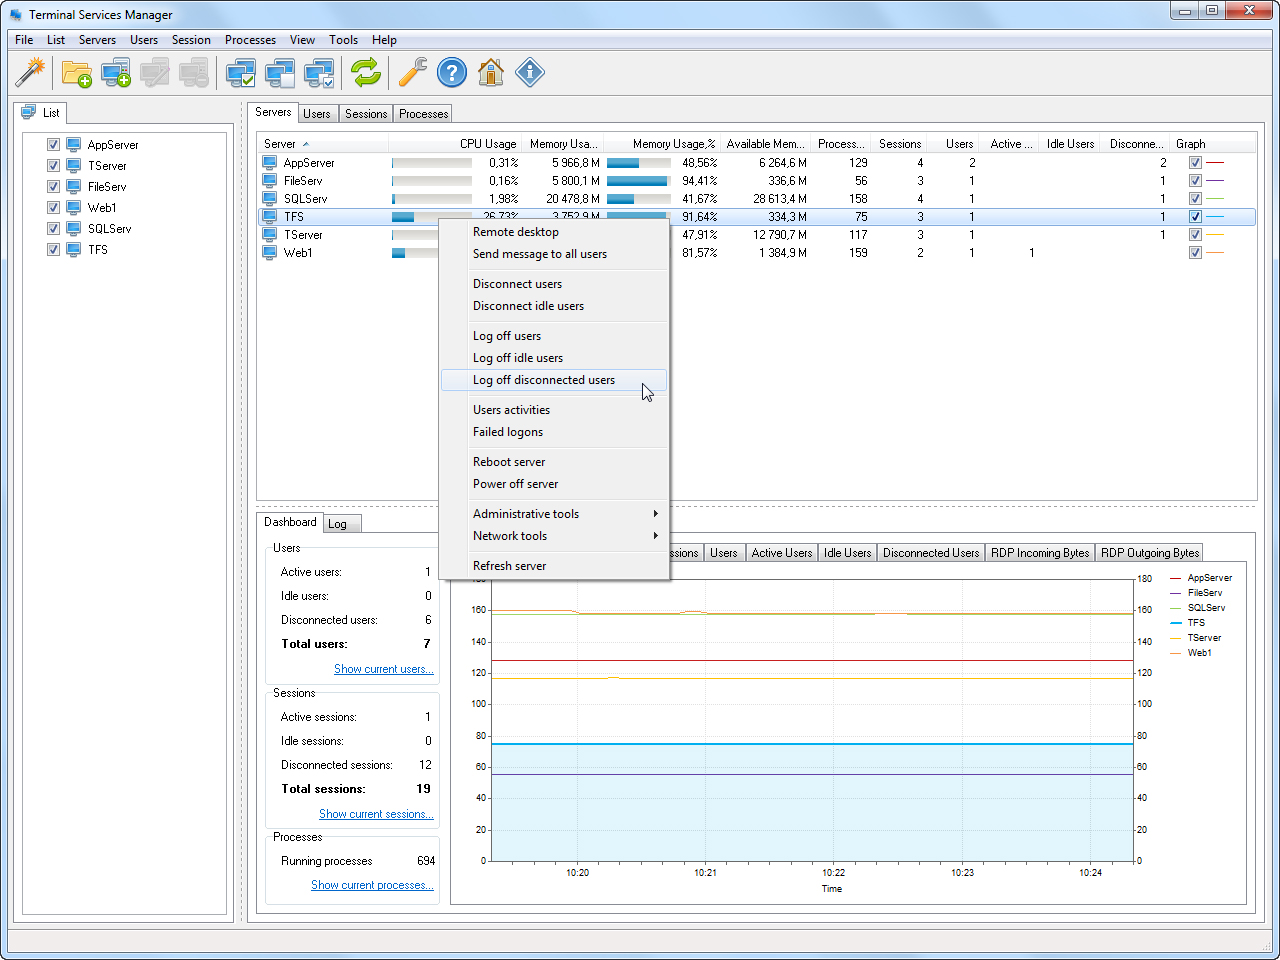
Track resource use per user. CPU and memory are shown per session, so a user consuming far more than the rest stands out at a glance.
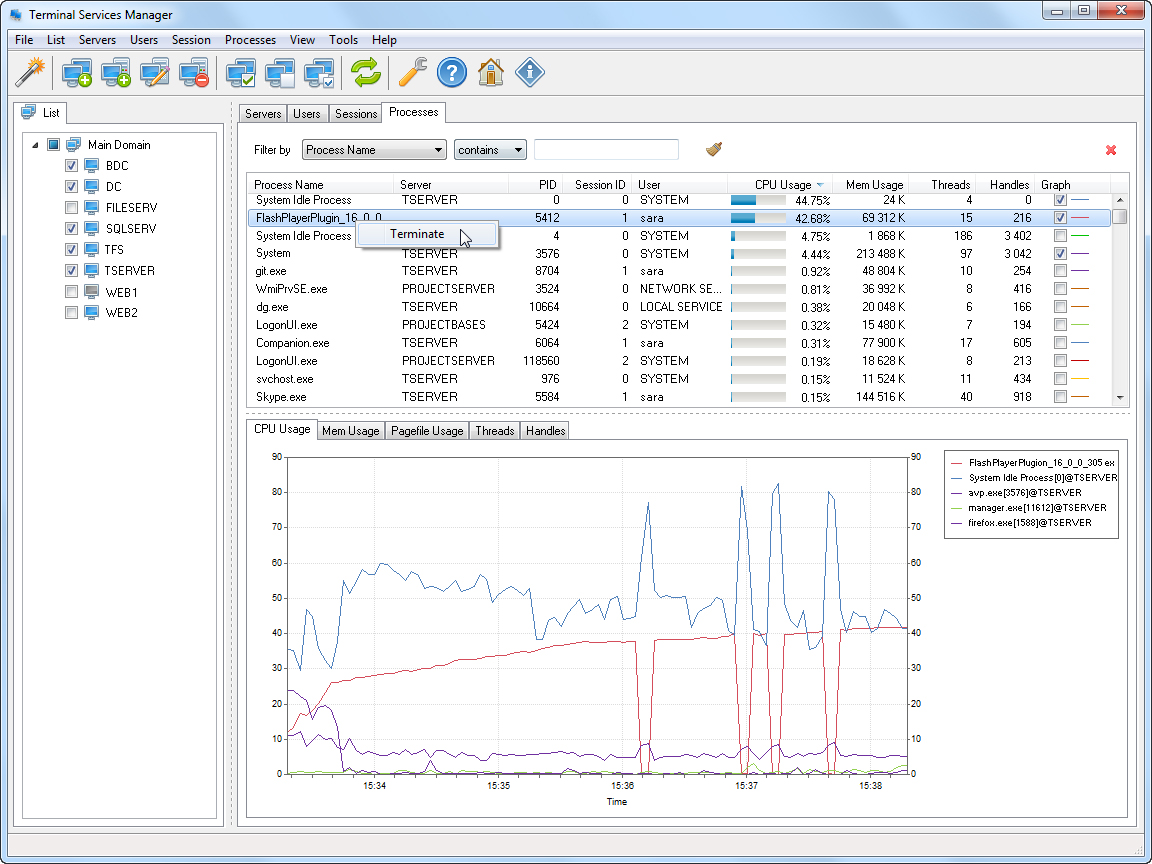
Find the process behind the load. Drill into a session to see its processes ranked by resource use, and end the one causing the problem without signing in to the server.
Beyond CPU and memory, the program reports the quality of each RDP connection from signals that hold up in practice: frame quality, frames skipped, packet loss, and retransmission, rolled into a Poor / Fair / Good / Excellent score. That gives you a read on the user's actual experience, not just server load.
Two things to check regularly
Watch for sustained high load. If a host sits at 80 to 90 percent CPU or memory for long stretches, sort the sessions by resource use and look at the top user's processes. Often it is one background task or a stuck application, not the whole server needing more hardware.
Clear out disconnected sessions. Sessions left in the disconnected state keep holding memory and a Remote Desktop license. Watch how many pile up, and log them off when they are clearly abandoned. See how to log off disconnected RDP sessions.
FAQ
How do I monitor terminal server sessions?
Use quser or qwinsta for a quick text list on one host, Task Manager's Users tab for live per-user resource use, and Performance Monitor's Terminal Services counters for a baseline. To watch every server at once with sorting and per-user detail, use Terminal Services Manager.
How do I see all active RDP sessions on a server?
Run quser /server:HOSTNAME from a command prompt, or open the Users tab in Task Manager on the host. Terminal Services Manager shows active, idle, and disconnected sessions from all your servers together.
Which performance counters show RDS sessions?
The Terminal Services object provides Active Sessions, Inactive Sessions, and Total Sessions for the host. The Terminal Services Session object holds per-session counters such as processor and memory use.
How do I monitor RDS sessions across multiple servers?
The built-in tools work one host at a time. Terminal Services Manager connects to all your Remote Desktop servers and shows their sessions, users, and processes in one window, so you do not switch consoles per server.
Related
- How to see who is logged on to a Remote Desktop server
- How to find which user is using high CPU on an RDS host
- How to log off disconnected RDP sessions
- How to audit RDP logon history