Reading the log
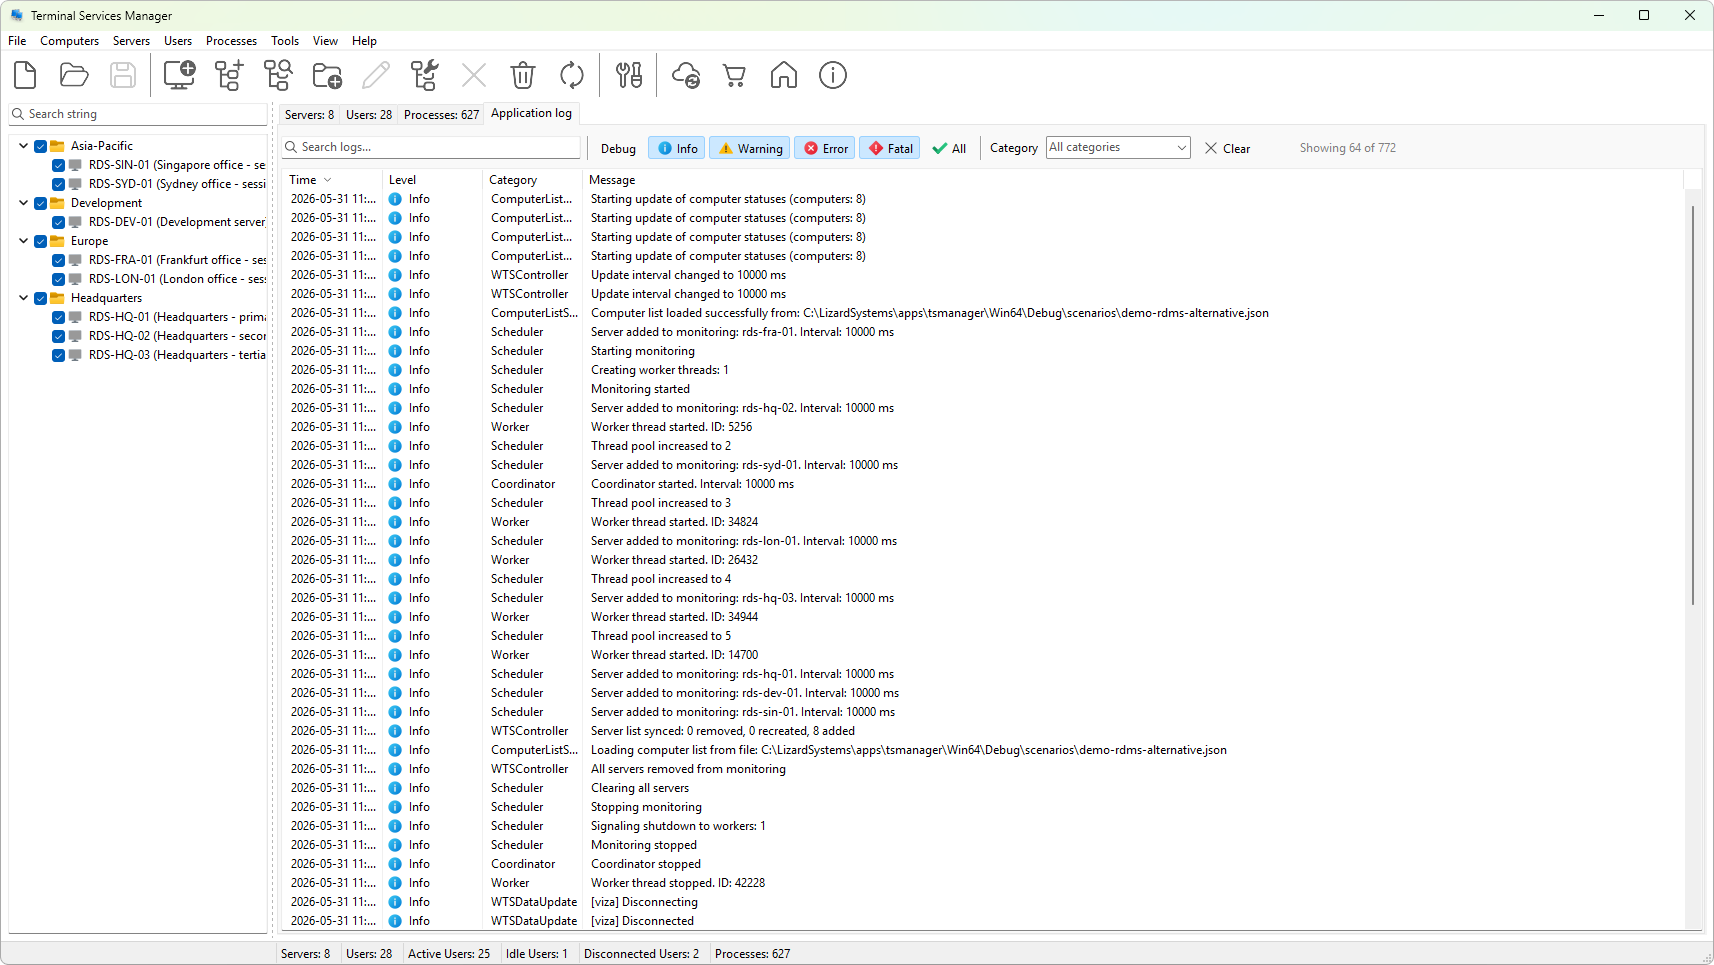
The Application log tab is a running record of the program's activity. Each entry has four columns:
- Time - when the entry was recorded, in local time.
- Level - how important it is, shown with an icon.
- Category - which part of the program produced it, such as a server connection or an action.
- Message - what happened.
What the levels mean
The level tells you whether an entry is routine or something to act on. From least to most serious:
- Debug - fine-grained detail, useful when you are tracing a problem and rarely otherwise.
- Info - normal activity, such as a successful connection or a completed action.
- Warning - something unexpected that the program handled, worth a look but not a failure.
- Error - an operation that failed, such as a server it could not reach.
- Fatal - a serious failure that stops part of the program from working.
When you are troubleshooting, read the Error and Warning entries first: they point straight at what went wrong. The Info entries around them give the context, showing what the program was doing at the time. Debug entries add the most detail and are most useful when you are reproducing a problem on purpose.
The log keeps the most recent entries in memory, so it shows current activity rather than a complete history. To capture what you see for later, filter and export it.
For the full reference, see the application log tab and log levels in the handbook.